Decode the market, outperform the competition
Master the market with app store insights and creative intelligence. Get the data you need to make confident growth decisions - all in one platform.


App Store Intelligence
Keep your finger on the industry's pulse, analyze top charts and build your personalized lists of favorites with ranking data and insights sourced directly from major stores.

Ad Insights
Access real-time intelligence on creative trends, ad performance, and user acquisition strategies. Track competitors, uncover winning ad campaigns, and power growth with data-backed decisions.
.webp)
Powered by data across the ecosystem
apps monitored globally
ad creatives analyzed
unique monthly players


.svg)


.svg)
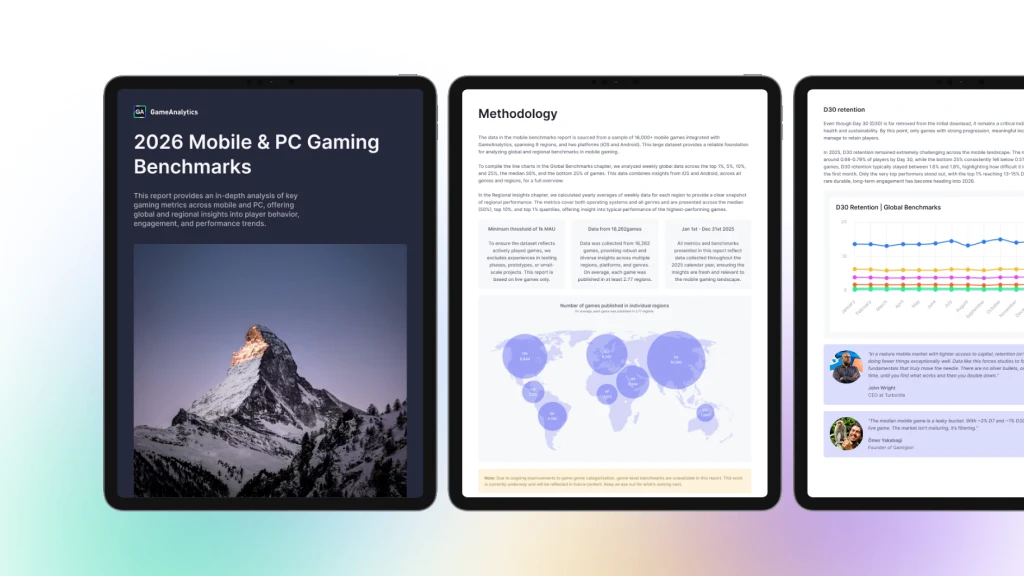
2026 Mobile & PC Gaming Benchmarks
This report provides an in-depth analysis of key gaming metrics across mobile and PC, offering global and regional insights into player behavior, engagement, and performance trends.
Get your free copy