This report provides an in-depth analysis of key gaming metrics across mobile and PC, offering global and regional insights into player behavior, engagement, and performance trends.
TL;DR
- Mobile retention kept sliding in 2025. Median D1 sat around 22%, D7 just under 4%, and D30 at roughly 0.7-0.8% - while the top 1% held 64-68% D1 and 13-15% D30, widening the gap between average and elite games.
- Engagement is concentrated at the very top. Median mobile games get ~12 min daily playtime, ~3.1-3.5 min sessions and ~3.8 sessions/day; the top 1% exceed 94 min playtime, 22 min sessions and 12+ daily sessions.
- Mobile is an everyday habit, not a weekend one. Playtime is spread evenly across the week (13-14% per weekday, ~16% Sat/Sun), which argues for short-session design and week-round live-ops rather than weekend-heavy event cadence.
- Regional baselines are similar; the divergence happens at the top. Western markets (Oceania, North America, Europe) lead on D7/D30 retention and session length, while Africa stands out on session frequency (5.48 median daily sessions, 21+ at P99) and peak playtime (115+ min at P99).
- PC engagement is depth-driven, so mobile-style retention reads differently. Median PC D1 is ~7% and D30 only ~0.2%, but median playtime is 32-33 min/day across ~18 min sessions and just 1.65-1.70 sessions/day - success on PC shows up in session length, playtime and DAU/MAU (median 4-5%, top 1% above 50%), and high new-user inflow alone doesn't convert into lasting engagement.
Data basis: 16,000+ mobile games across 9 regions (1,000+ MAU threshold) and 3,582 PC games (100+ MAU, 4+ months live), all 2025 calendar year. Genre-level cuts aren't included this cycle.
Introduction to GameAnalytics benchmarks
Powered by one of the largest and most diverse datasets in gaming, GameAnalytics is uniquely positioned to deliver industry benchmarks at scale. Tens of thousands of games across all platforms rely on GameAnalytics every day to understand player behavior, optimize performance, and grow sustainably. These games span multiple platforms, regions, and business models, giving us a uniquely comprehensive view of how games are actually played today.
This allows us to go beyond isolated success stories or niche markets. By analyzing real gameplay data across platforms, regions, and engagement levels, we surface trends and patterns that reflect the true state of the industry. From retention and session behavior to playtime and engagement depth, our benchmarks are grounded in real-world performance.
The 2026 Mobile & PC Benchmarks are designed to help developers and publishers answer the most important questions:
- How is my game performing compared to the wider market?
- Where are players dropping off, and where are we outperforming others?
- What should we focus on next to improve engagement, retention, or monetization?
While this report focuses specifically on Mobile and PC, it is part of a broader benchmarks initiative. Alongside this report, we also publish Roblox Benchmarks and Advertising Insights, giving developers a connected view of gameplay performance, platform dynamics, and market-facing strategies.
Together, these benchmarks provide the context needed to make confident, data-backed decisions. They help you understand where your game stands today and what it takes to move forward in 2026. Whether you’re shipping your first game, scaling a live title, or planning your next release.
2026 Mobile Gaming Benchmarks
Mobile games continue to sit at the center of the global games industry. They reach the largest audiences, generate the majority of industry revenue, and set the pace for innovation in live operations, monetization, and player engagement. From indie studios to the world’s largest publishers, mobile remains the platform where scale, creativity, and commercial success intersect.
As the mobile market matures, access to high-quality data becomes increasingly important. Understanding how games perform across key metrics like engagement, retention, and session behavior is essential. Not just for optimizing individual titles, but for raising the overall standard of mobile game development. These benchmarks are designed with that goal in mind: to make performance expectations clear, comparable, and accessible to everyone building in the space.
By openly sharing insights drawn from thousands of live mobile games, this report aims to support developers at every stage: from early experimentation to large-scale live operations. The more clearly performance benchmarks are understood, the easier it becomes to build better games, deliver more engaging experiences, and continue pushing mobile gaming forward as the industry’s leading platform.
Key Highlights
Global benchmarks
- Retention pressure intensified in 2025: Baseline D1, D7, and D30 retention continued to decline, widening the gap between average games and top performers and making early engagement more critical than ever.
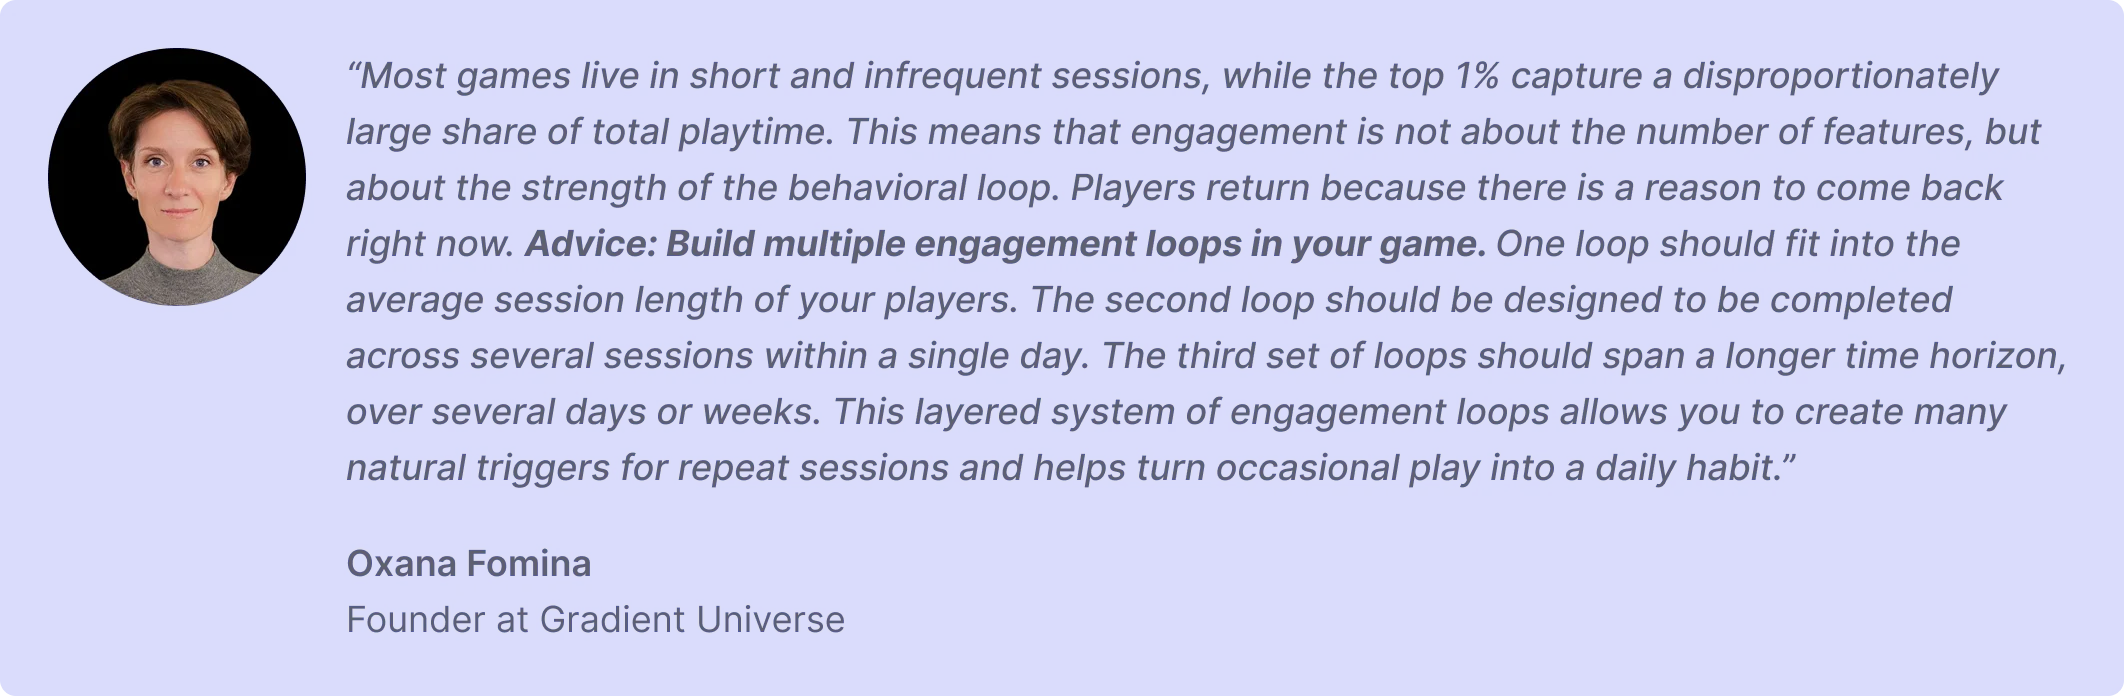
- Engagement is concentrated at the top: Most games see short, infrequent sessions, while a small group of top performers capture a disproportionate share of playtime, session frequency, and long-term engagement.
- Mobile gaming remains a daily behavior: Player activity is evenly distributed throughout the week, reinforcing mobile’s role as a constant, everyday touchpoint rather than a weekend-driven platform.
Regional insights
- Regional baselines are stable; differentiation happens at the top: Median retention and engagement metrics are broadly consistent across regions, while the largest gaps emerge among top-performing games.
- Western markets lead in long-term engagement: North America, Europe, and Oceania consistently outperform on D7 and D30 retention, reflecting stronger long-term player commitment.
- Engagement patterns differ by region: Some regions favor frequent daily sessions, while others lean toward fewer, longer play sessions, reinforcing the need for region-aware design and live-ops strategies.
Methodology
The data in the mobile benchmarks report is sourced from a sample of 16,000+ mobile games integrated with GameAnalytics, spanning 9 regions, and two platforms (iOS and Android). This large dataset provides a reliable foundation for analyzing global and regional benchmarks in mobile gaming.
To compile the line charts in the Global Benchmarks chapter, we analyzed weekly global data across the top 1%, 5%, 10%, and 25%, the median 50%, and the bottom 25% of games. This data combines insights from iOS and Android, across all genres and regions, for a full overview.
In the Regional Insights chapter, we calculated yearly averages of weekly data for each region to provide a clear snapshot of regional performance. The metrics cover both operating systems and all genres and are presented across the median (50%), top 10%, and top 1% quantiles, offering insight into typical performance and the behavior of the highest-performing games.
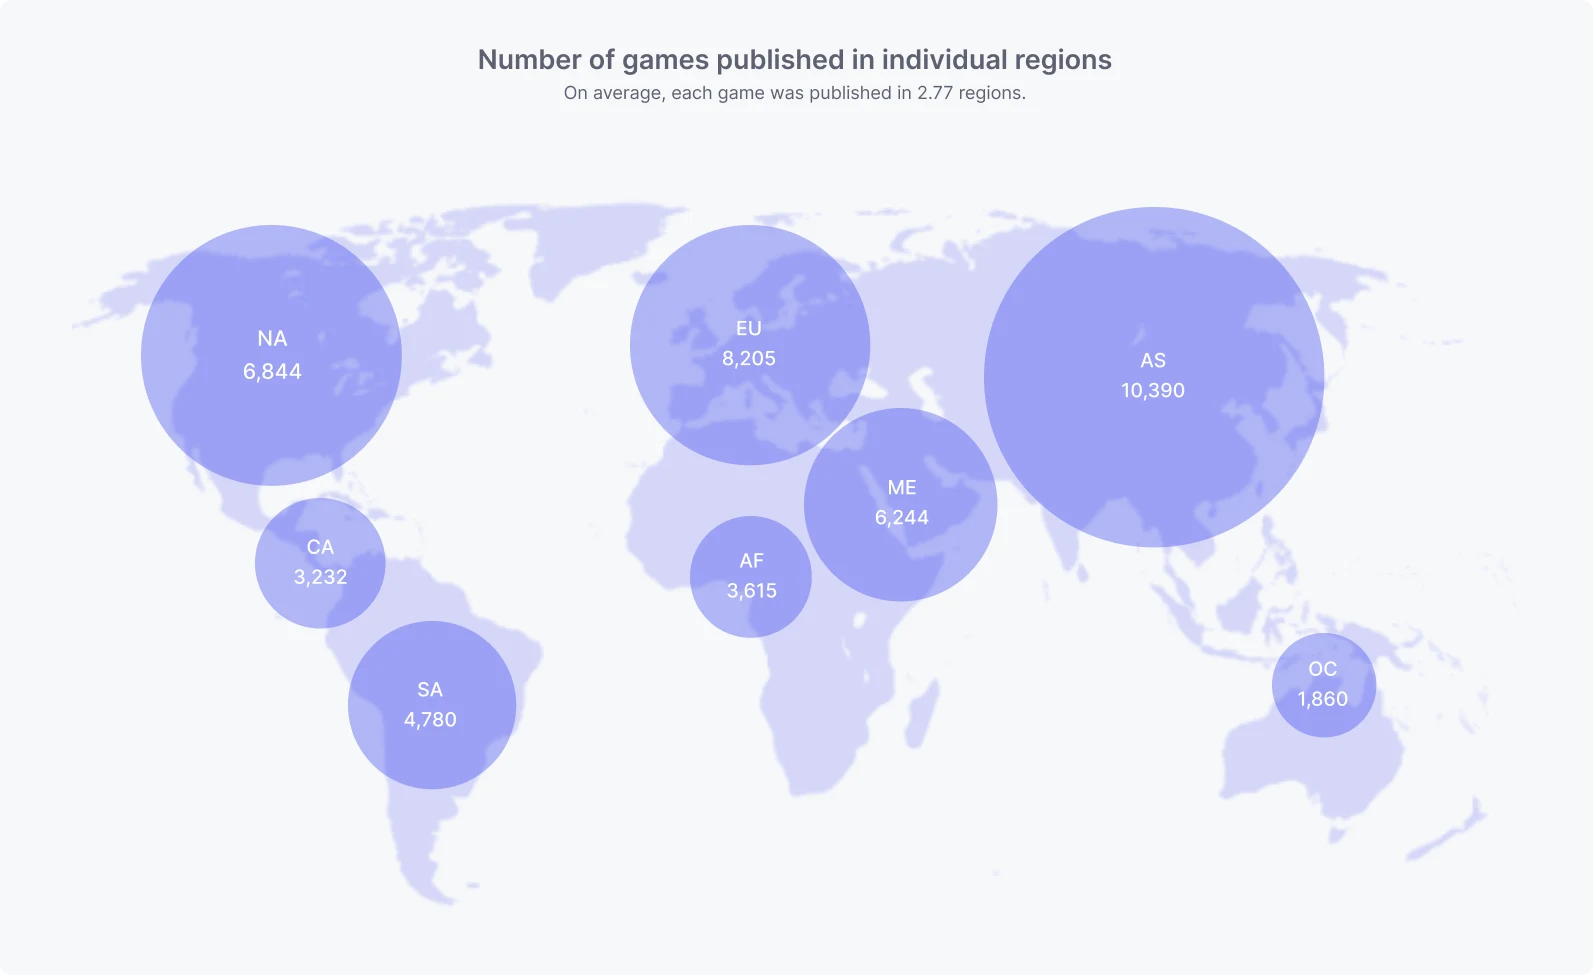
- Data from 16K games: Data was collected from 16,000+ games, providing robust and diverse insights across multiple regions, platforms, and genres. It's worth noting that each game was published in multiple regions.
- Jan 1st - Dec 31 2025: All metrics and benchmarks presented in this report reflect data collected throughout the 2025 calendar year, ensuring the insights are fresh and relevant to today’s mobile gaming landscape.
- MAU threshold: To ensure the dataset reflects actively played games, we applied a minimum threshold of 1,000 MAU. This excludes experiences in testing phases, prototypes, or small-scale projects, and ensures the benchmarks are based on live, player-facing games.
Note: Due to ongoing improvements to game genre categorization, genre-level benchmarks are unavailable in this report. This work is currently underway and will be reflected in future content. Keep an eye out for what’s coming next.
Global benchmarks
Retention
First, we will explore retention, one of the most critical metrics for understanding the health and success of a mobile game. Retention measures the percentage of players who return to your game after their initial play session, typically tracked on key milestones like Day 1 (D1), Day 7 (D7), and Day 30 (D30). It’s widely regarded as the most critical metric in mobile gaming as it directly impacts every aspect of a game’s lifecycle: notably, user acquisition, monetization, and player engagement.
Retention is the foundation of a sustainable and prosperous game as it measures how well your game resonates with players over time. A game with poor retention won’t survive long, regardless of how many users are acquired. Conversely, strong retention indicates players are finding value, enjoyment, or a reason to return.
D1 Retention
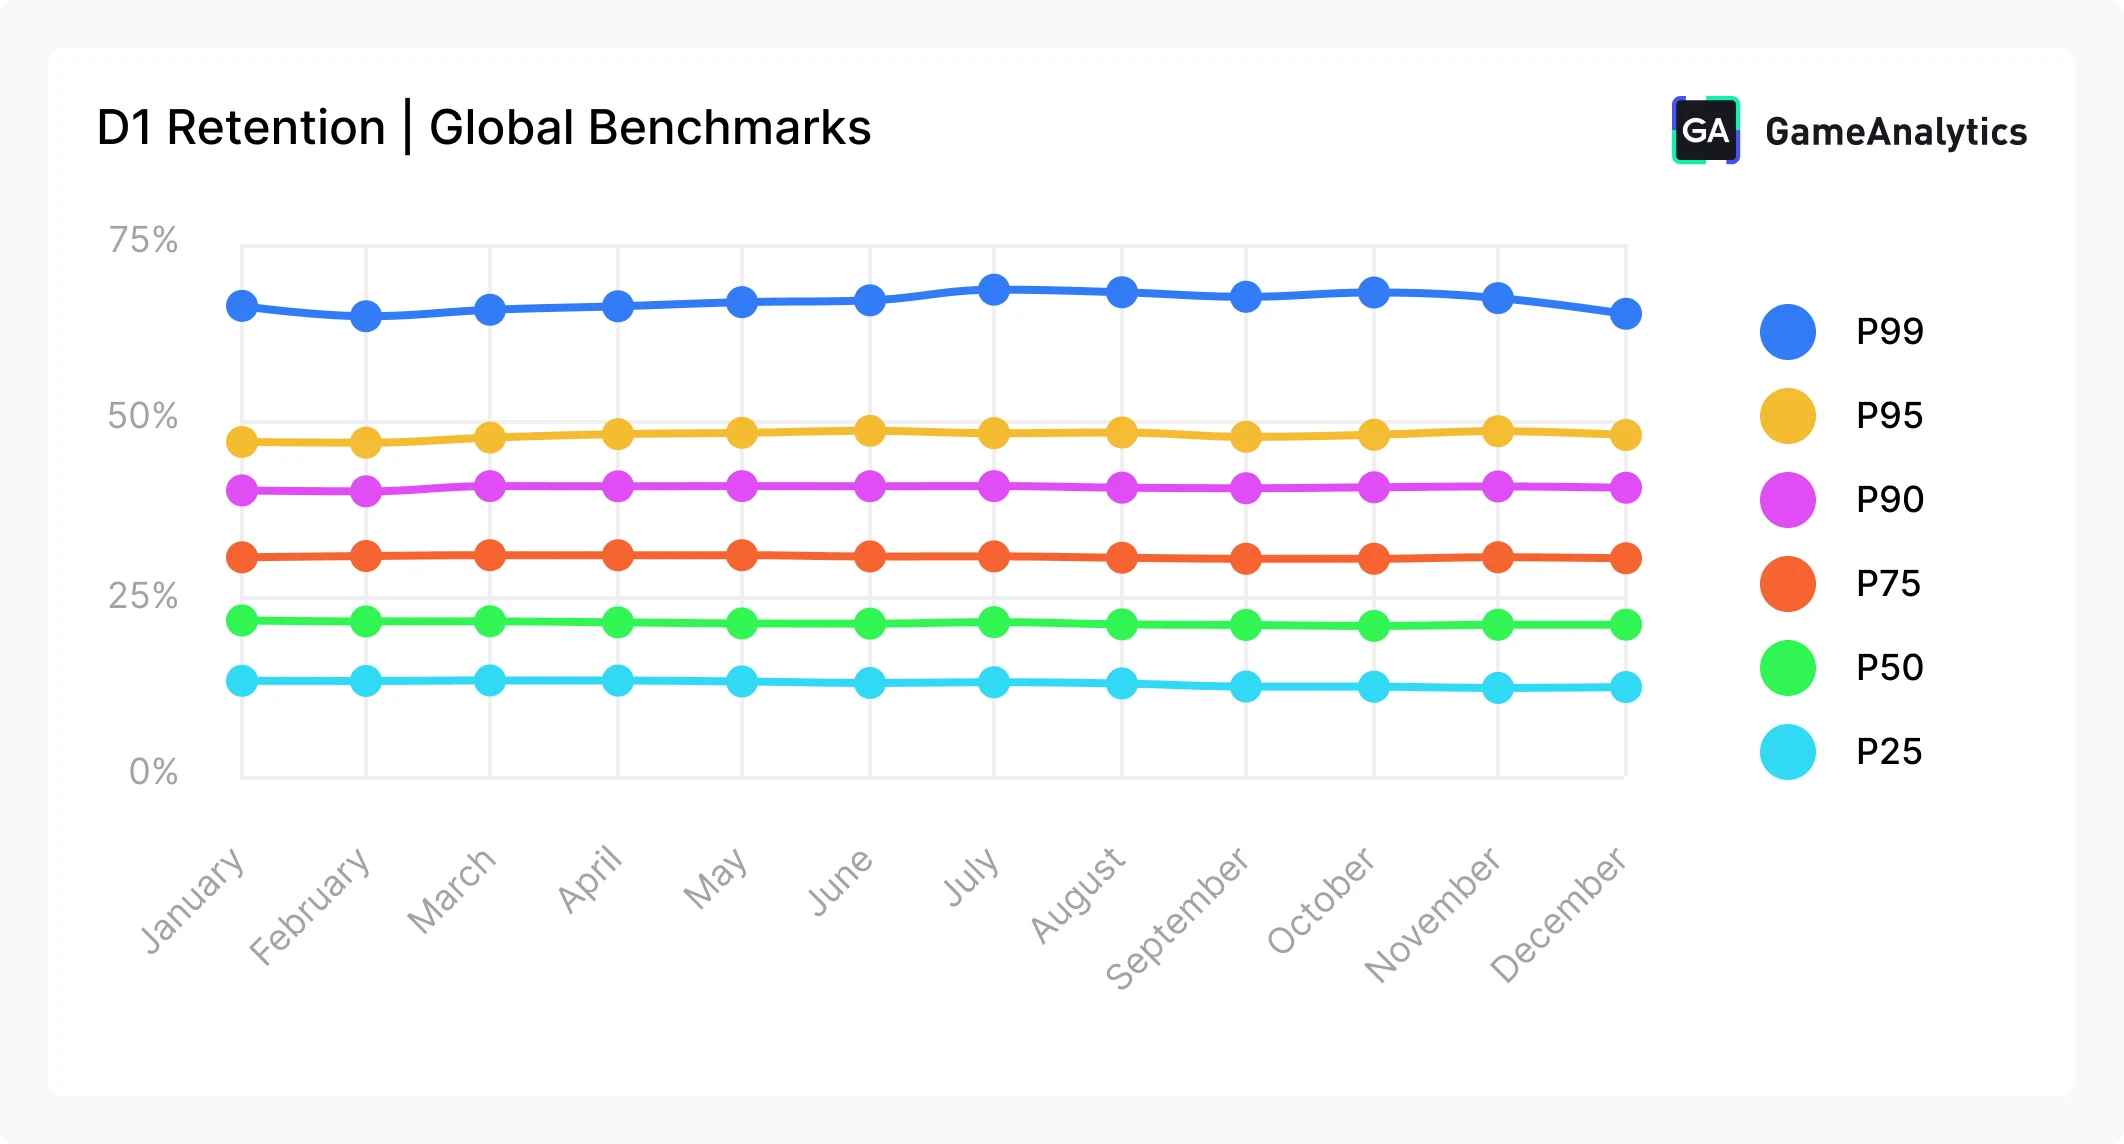
In 2025, Day 1 retention continued its downward trend from 2024, reinforcing how challenging early player engagement has become. At the start of the year, median games (P50) recorded a D1 retention of around 22%. Such a low number highlights rising player expectations and the growing difficulty of making a strong first impression.
Even among stronger performers, pressure was evident. The top 25% of games (P75) display D1 retention just above 30%; meanwhile, the bottom 25% (P25) experienced a drop, declining from 13.42% to 12.45%, underscoring how unforgiving the market has become for games that fail to hook players immediately.
At the high end of the spectrum, elite performers continued to stand apart. The top 10% (P90) maintained D1 retention at around 40% for the whole year, while the top 1% (P99) consistently achieved D1 retention in the 64-68% range. This gap highlights just how decisive a polished onboarding experience and strong early gameplay loop can be.
D7 Retention
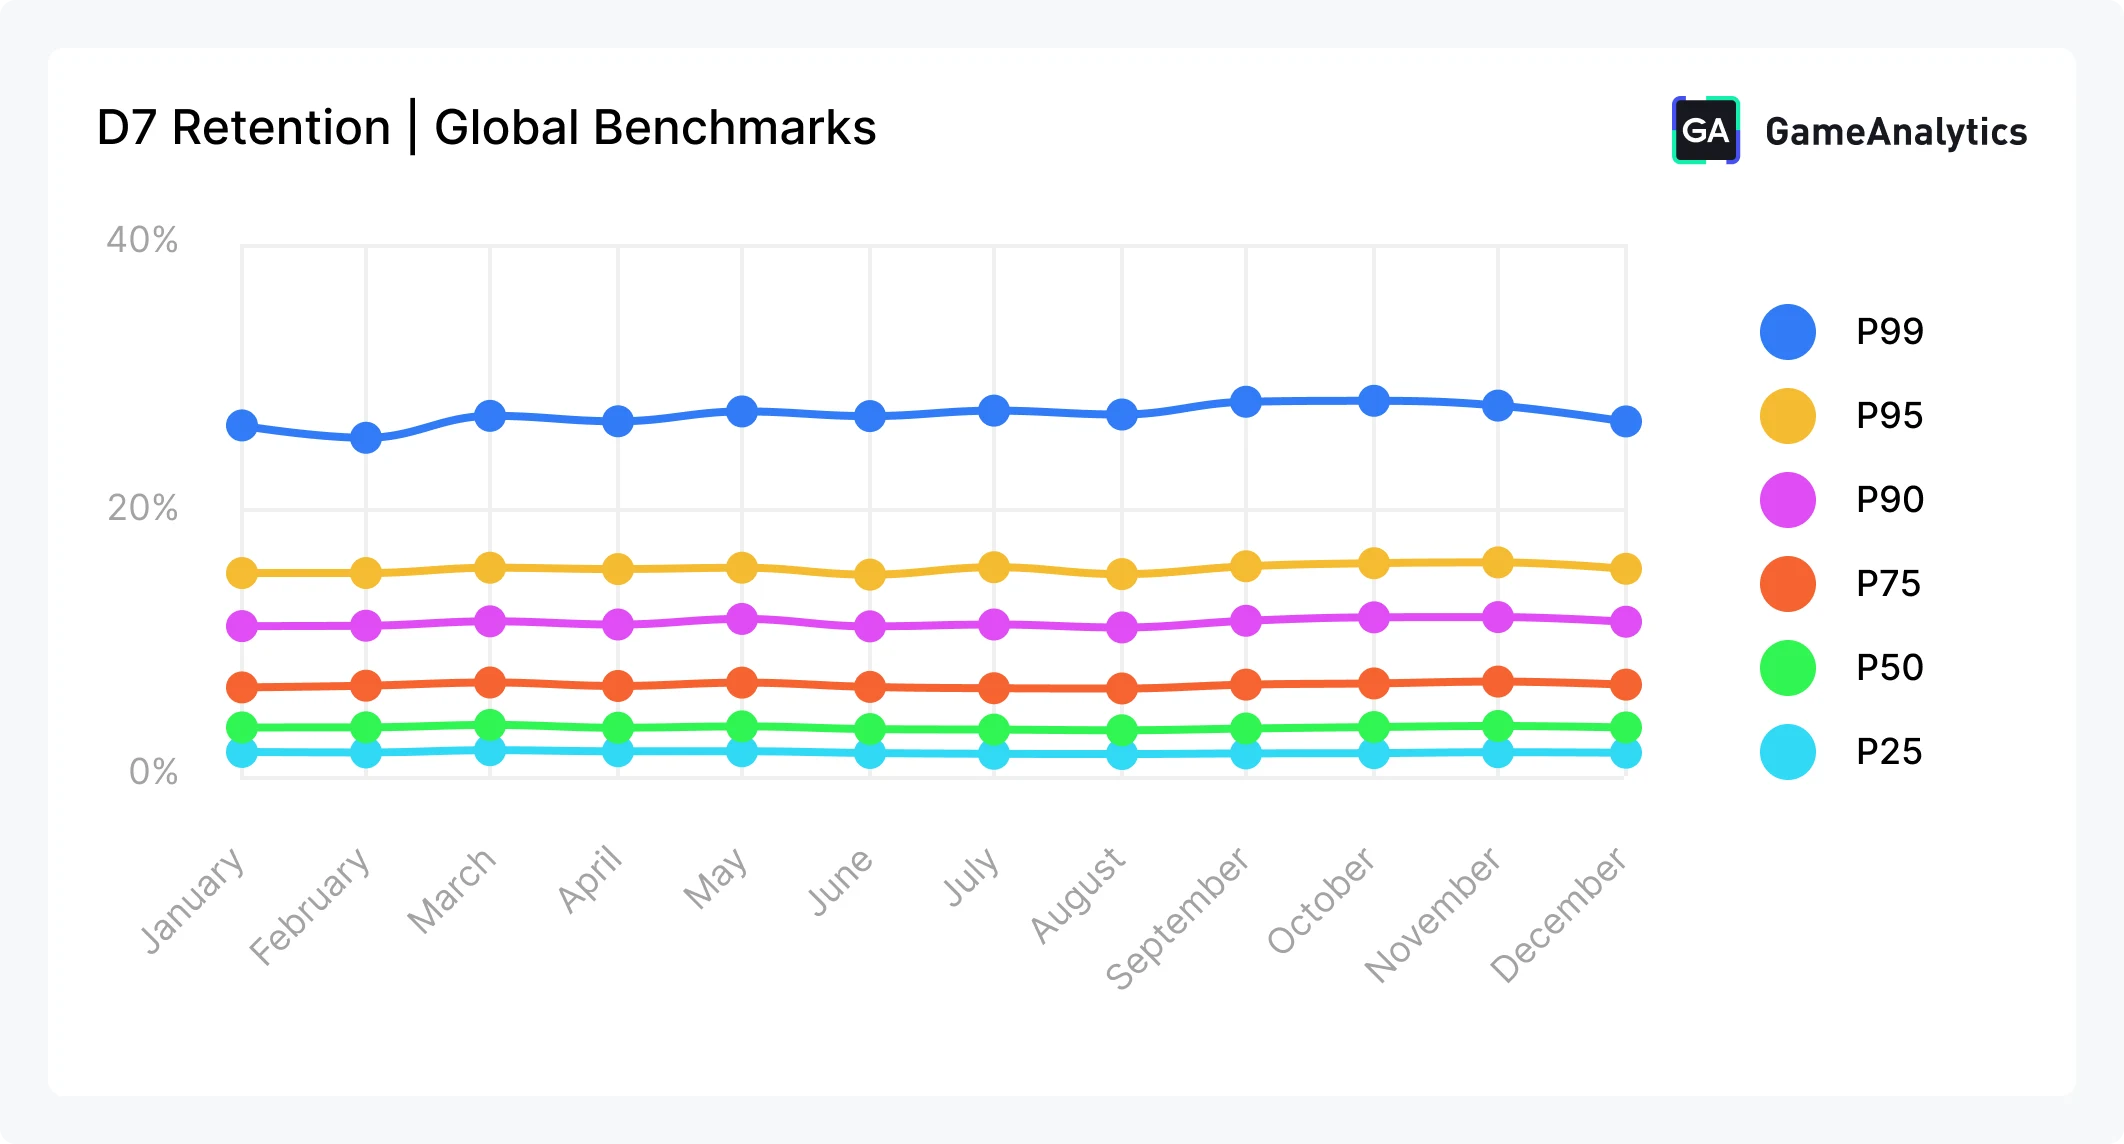
In 2025, Day 7 retention remained under sustained pressure, reinforcing how difficult it has become to keep players engaged beyond the first week. Median games (P50) recorded D7 retention just under 4% throughout the year.
The gap between performance tiers remained pronounced. The bottom 25% of games (P25) hovered between 1.67% and 1.94%, highlighting how quickly players disengage when early gameplay fails to evolve. Meanwhile, the top 25% (P75) consistently delivered D7 retention in the 6-7% range.
At the upper end, standout games continued to set themselves apart. The top 10% (P90) maintained D7 retention around 11-12% for most of 2025, while the top 1% (P99) regularly exceeded 25%, peaking above 28% in a couple of months. These top performers demonstrate that strong progression systems, live operations, and meaningful mid-game hooks can still drive sustained engagement (but they are increasingly rare).

D30 Retention
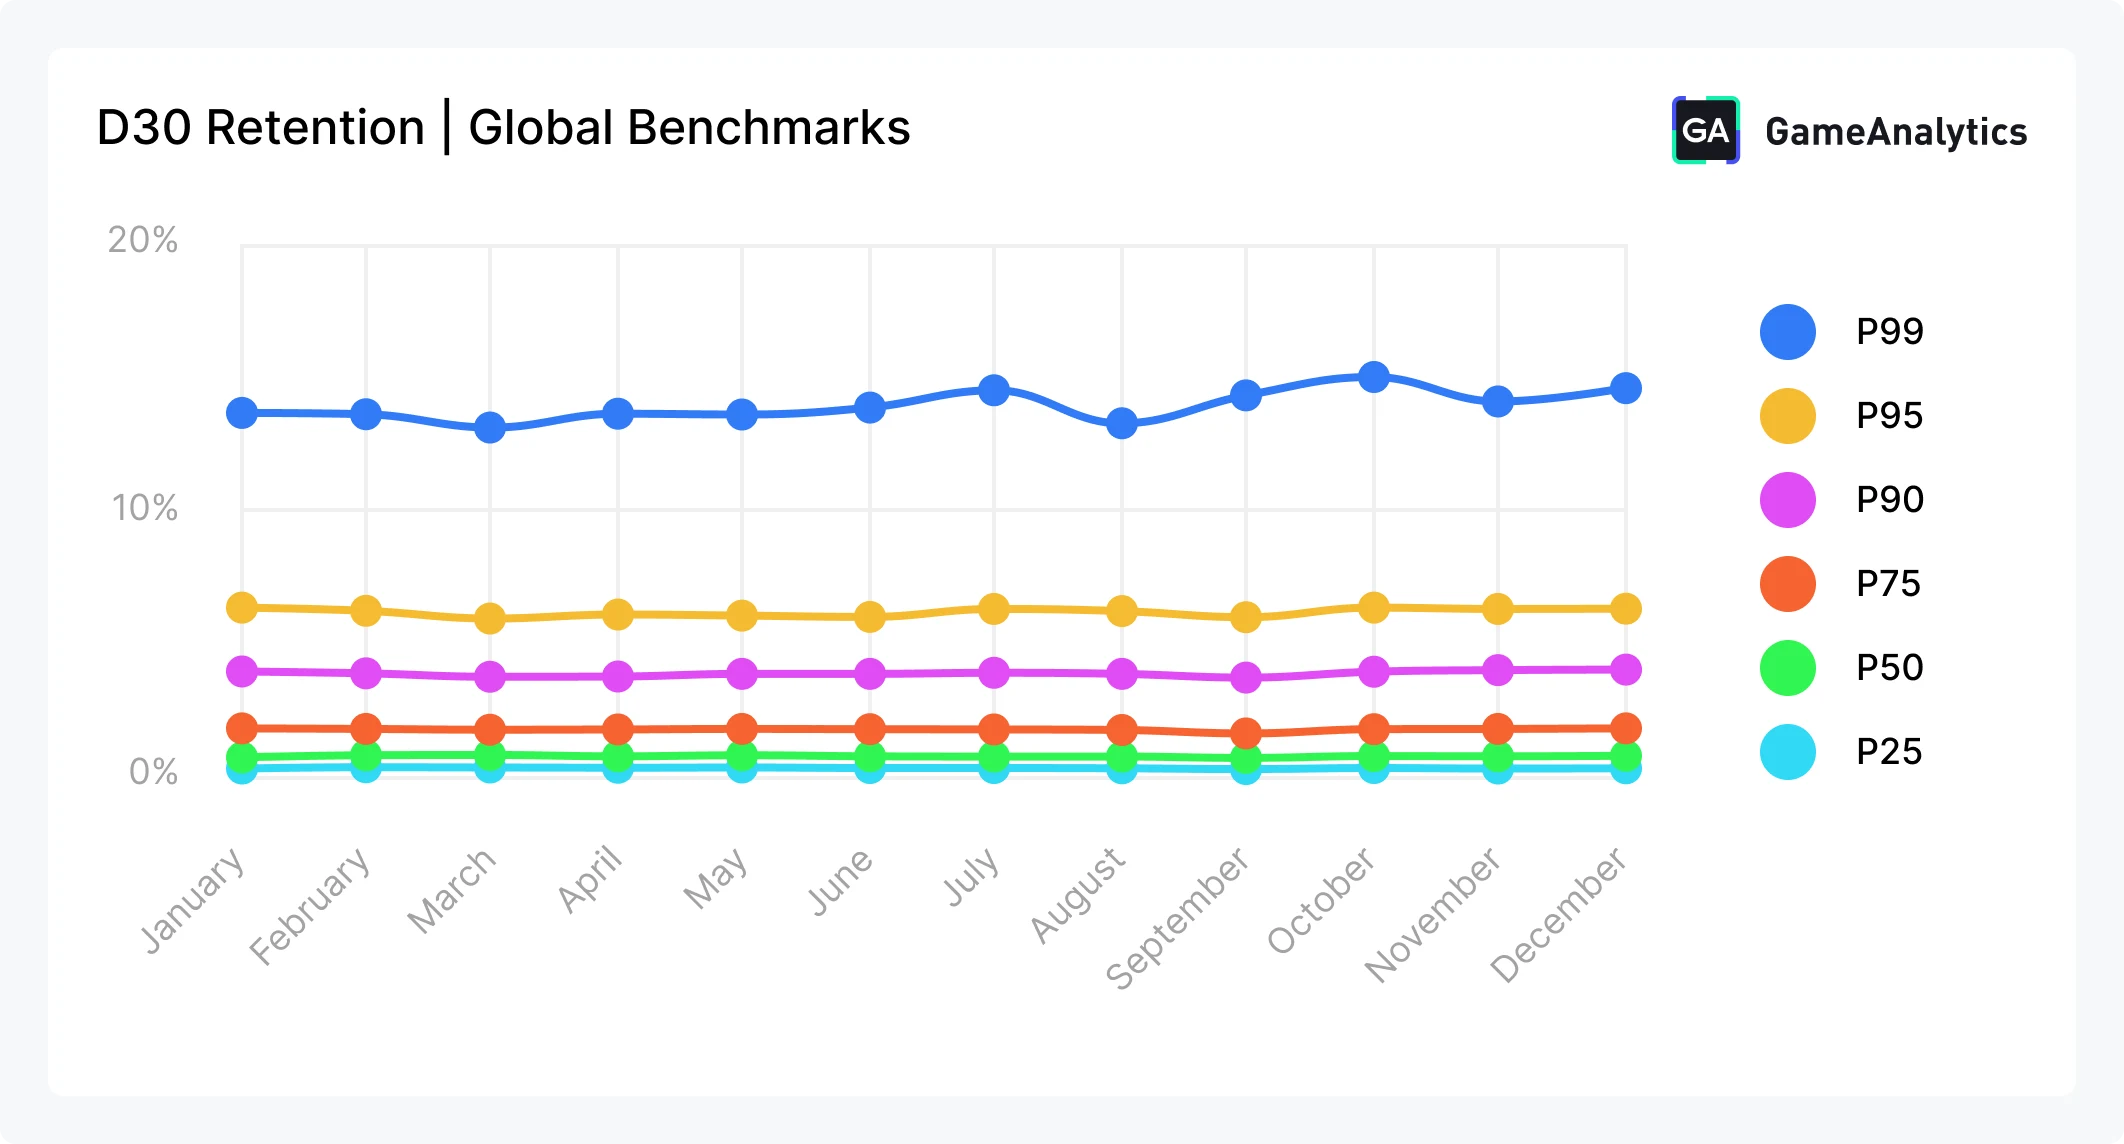
Even though Day 30 (D30) is far removed from the initial download, it remains a critical indicator of a game’s long-term health and sustainability. By this point, only games with strong progression, meaningful incentives, and ongoing content manage to retain players.
In 2025, D30 retention remained extremely challenging across the mobile landscape. The median game (P50) retained just around 0.68-0.79% of players by Day 30, while the bottom 25% consistently fell below 0.5%. Even among the top 25% of games, D30 retention typically stayed between 1.6% and 1.8%, highlighting how difficult it is to sustain engagement beyond the first month. Only the very top performers stood out, with the top 1% reaching 13-15% D30 retention, underscoring how rare durable, long-term engagement has become heading into 2026.

Engagement
Playtime distribution by days of the week
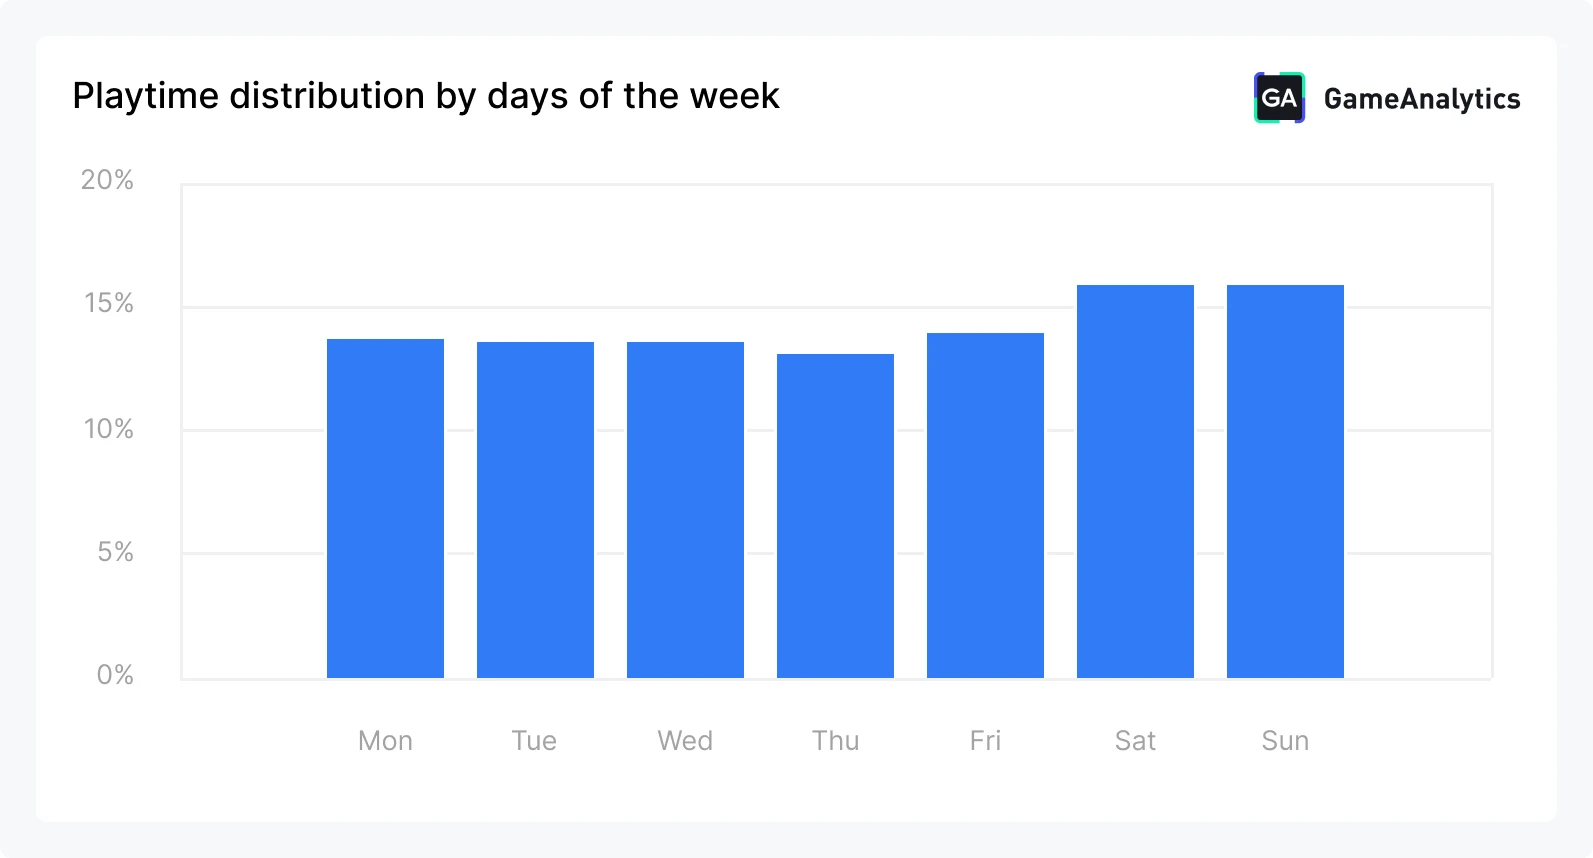
This distribution highlights one of mobile gaming's defining strengths: its consistency. Playtime is spread evenly across the entire week, with each weekday contributing roughly 13-14% of total playtime. While weekends do see a modest lift, Saturday (15.92%) and Sunday (15.93%), the increase is minimal.
This pattern reflects the always-on nature of mobile games. As players carry their phones with them throughout the day, mobile gaming fits naturally into daily routines, during commutes, short breaks, and moments of downtime, rather than being reserved for longer, planned sessions on weekends.
For developers, this consistency reinforces the importance of designing experiences that support frequent, short sessions and maintaining live-ops cadence across the entire week, rather than concentrating updates or events solely around weekends.
Playtime
Playtime measures the total amount of time a player spends in a game per day, combining all sessions. It remains one of the strongest indicators of engagement depth, reflecting how embedded a game is in players’ daily routines.
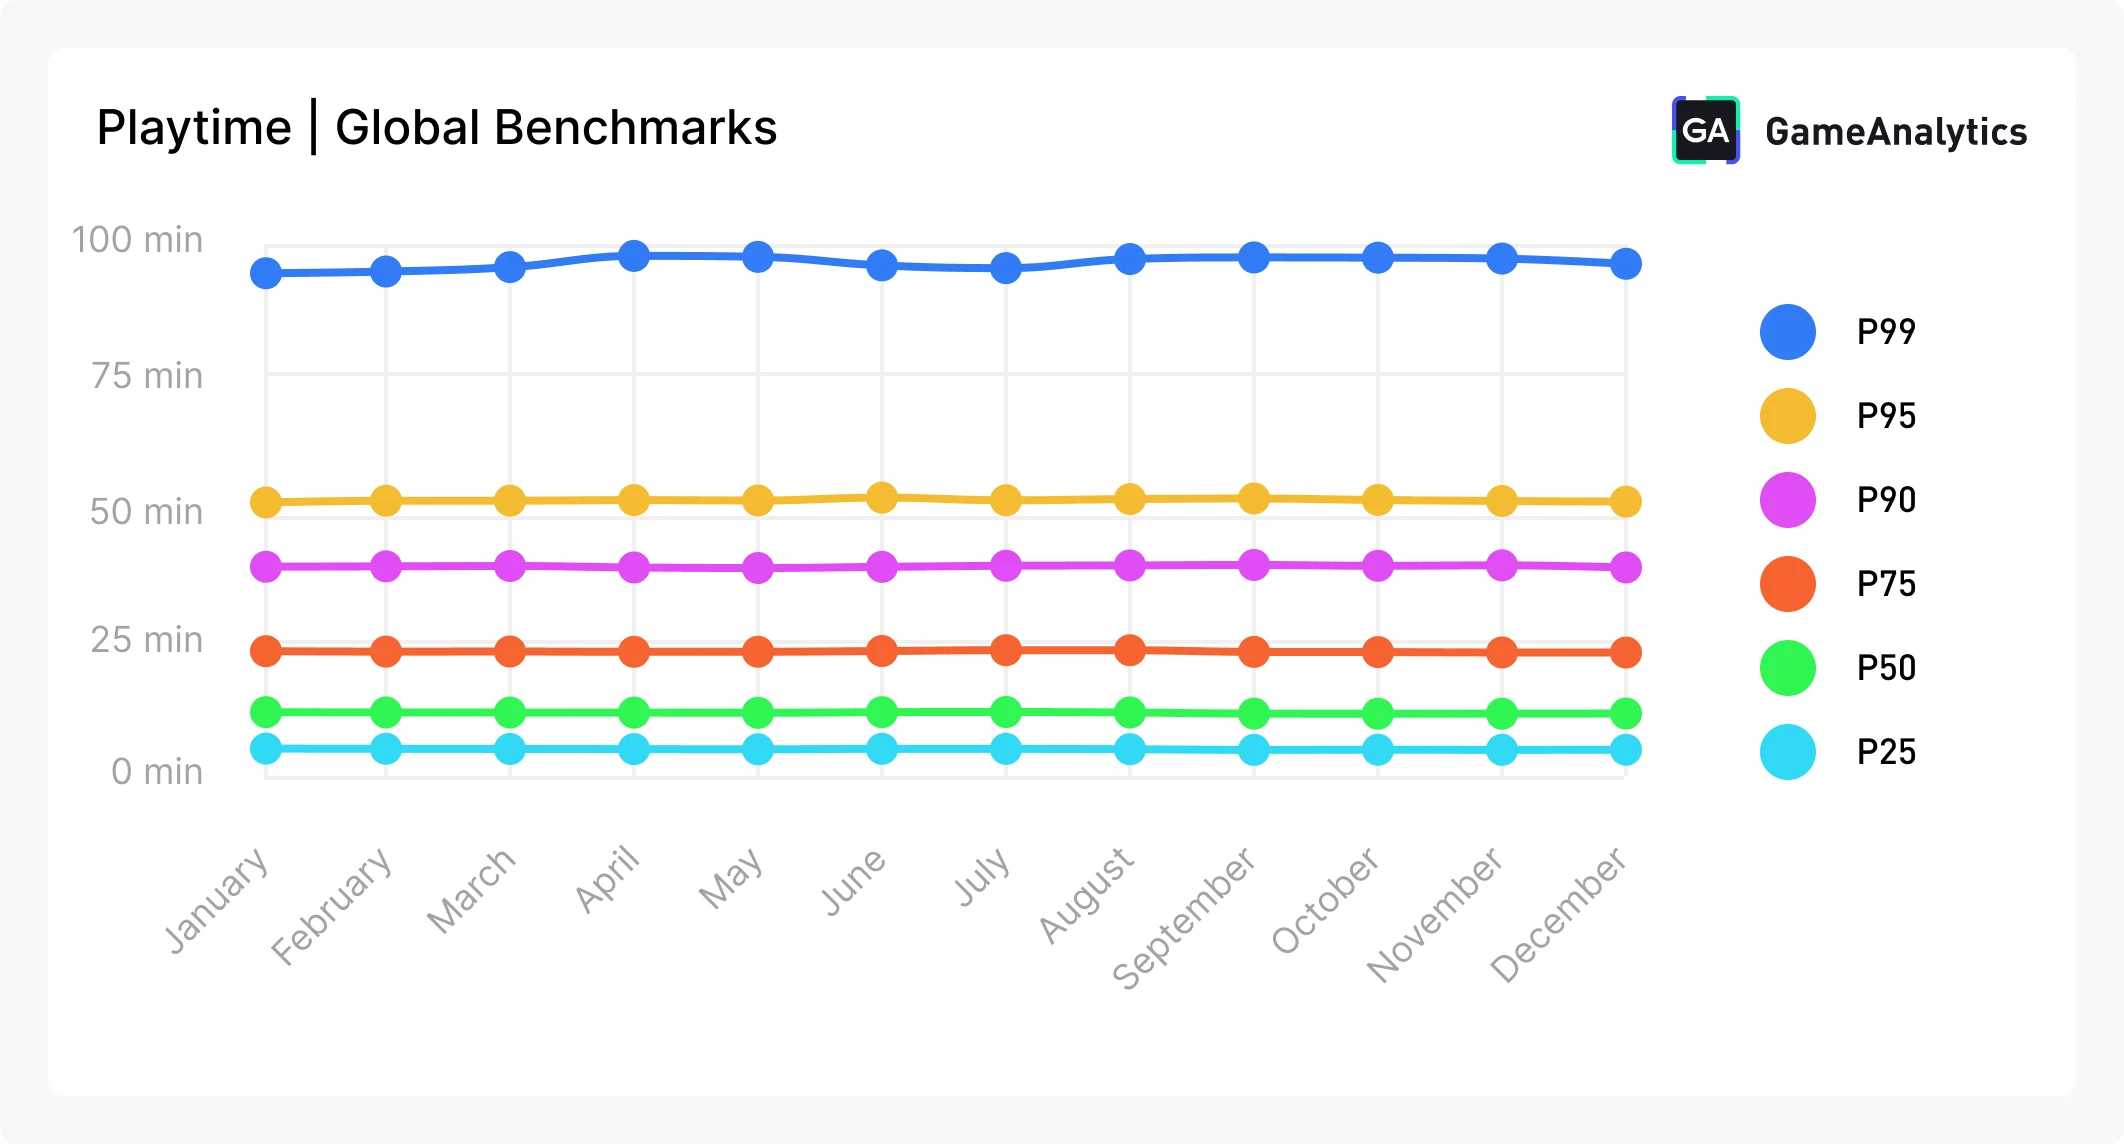
In 2025, daily playtime remained remarkably stable throughout the year, with only a gradual upward shift toward the higher engagement tiers. Median games (P50) averaged at around 12 minutes per day. While modest, this consistency highlights how most mobile games continue to compete for short, frequent moments of attention rather than extended play.
The contrast between performance tiers, however, is substantial. The top 25% of games (P75) consistently delivered 22-24 minutes of daily playtime, while the top 10% (P90) averaged close to 40-42 minutes by the end of the year. At the very top, the top 1% (P99) regularly exceeded 94 minutes of daily playtime, peaking above 99 minutes in April and May, underlining how a small group of games captures a disproportionate share of player attention.
Session length
Session length measures the average duration of a single play session and provides insight into how long players stay engaged in one sitting. It reflects the depth and pacing of the experience, as well as how naturally a game fits into players’ daily routines.
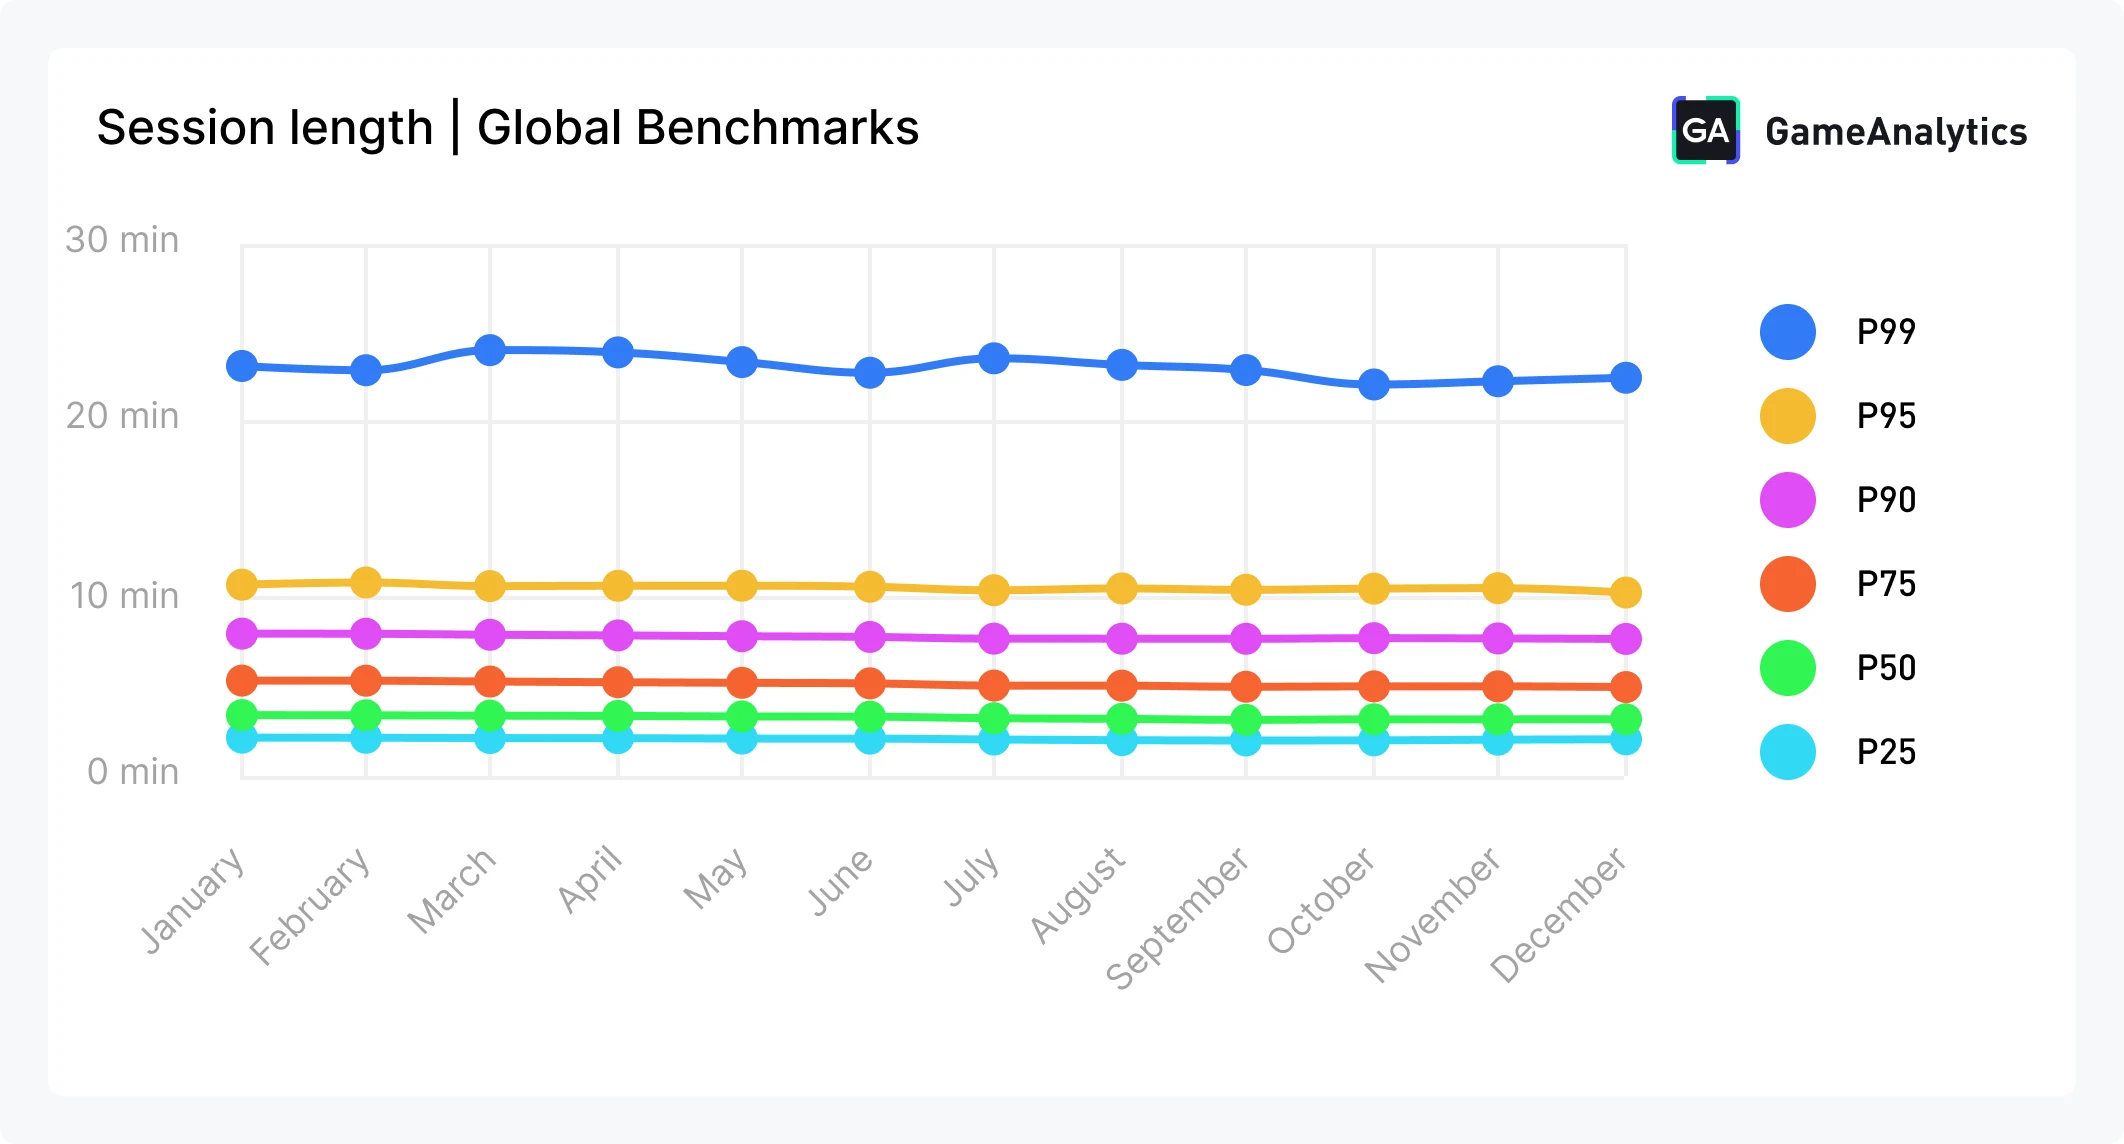
In 2025, session lengths remained stable but shorter than in previous years, reinforcing the shift toward more bite-sized engagement on mobile. Median games (P50) consistently recorded session lengths between 3.1 and 3.5 minutes throughout the year. The top 25% of games (P75) averaged around 5.2 minutes per session, while the top 10% (P90) reached just over 8 minutes, showing that longer single-session engagement is increasingly concentrated among a smaller group of games.
At the upper end, standout performers continued to differentiate themselves. The top 1% of games (P99) regularly exceeded 22 minutes per session, peaking just above 24 minutes in March. These outliers typically reflect games with deeper progression, social mechanics, or content that encourages extended, uninterrupted play.
Session count
Session count measures how often players return to a game within a day, offering insight into engagement frequency and habitual play. While session length captures how long players stay in a single sitting, session count highlights how well a game fits into daily routines.
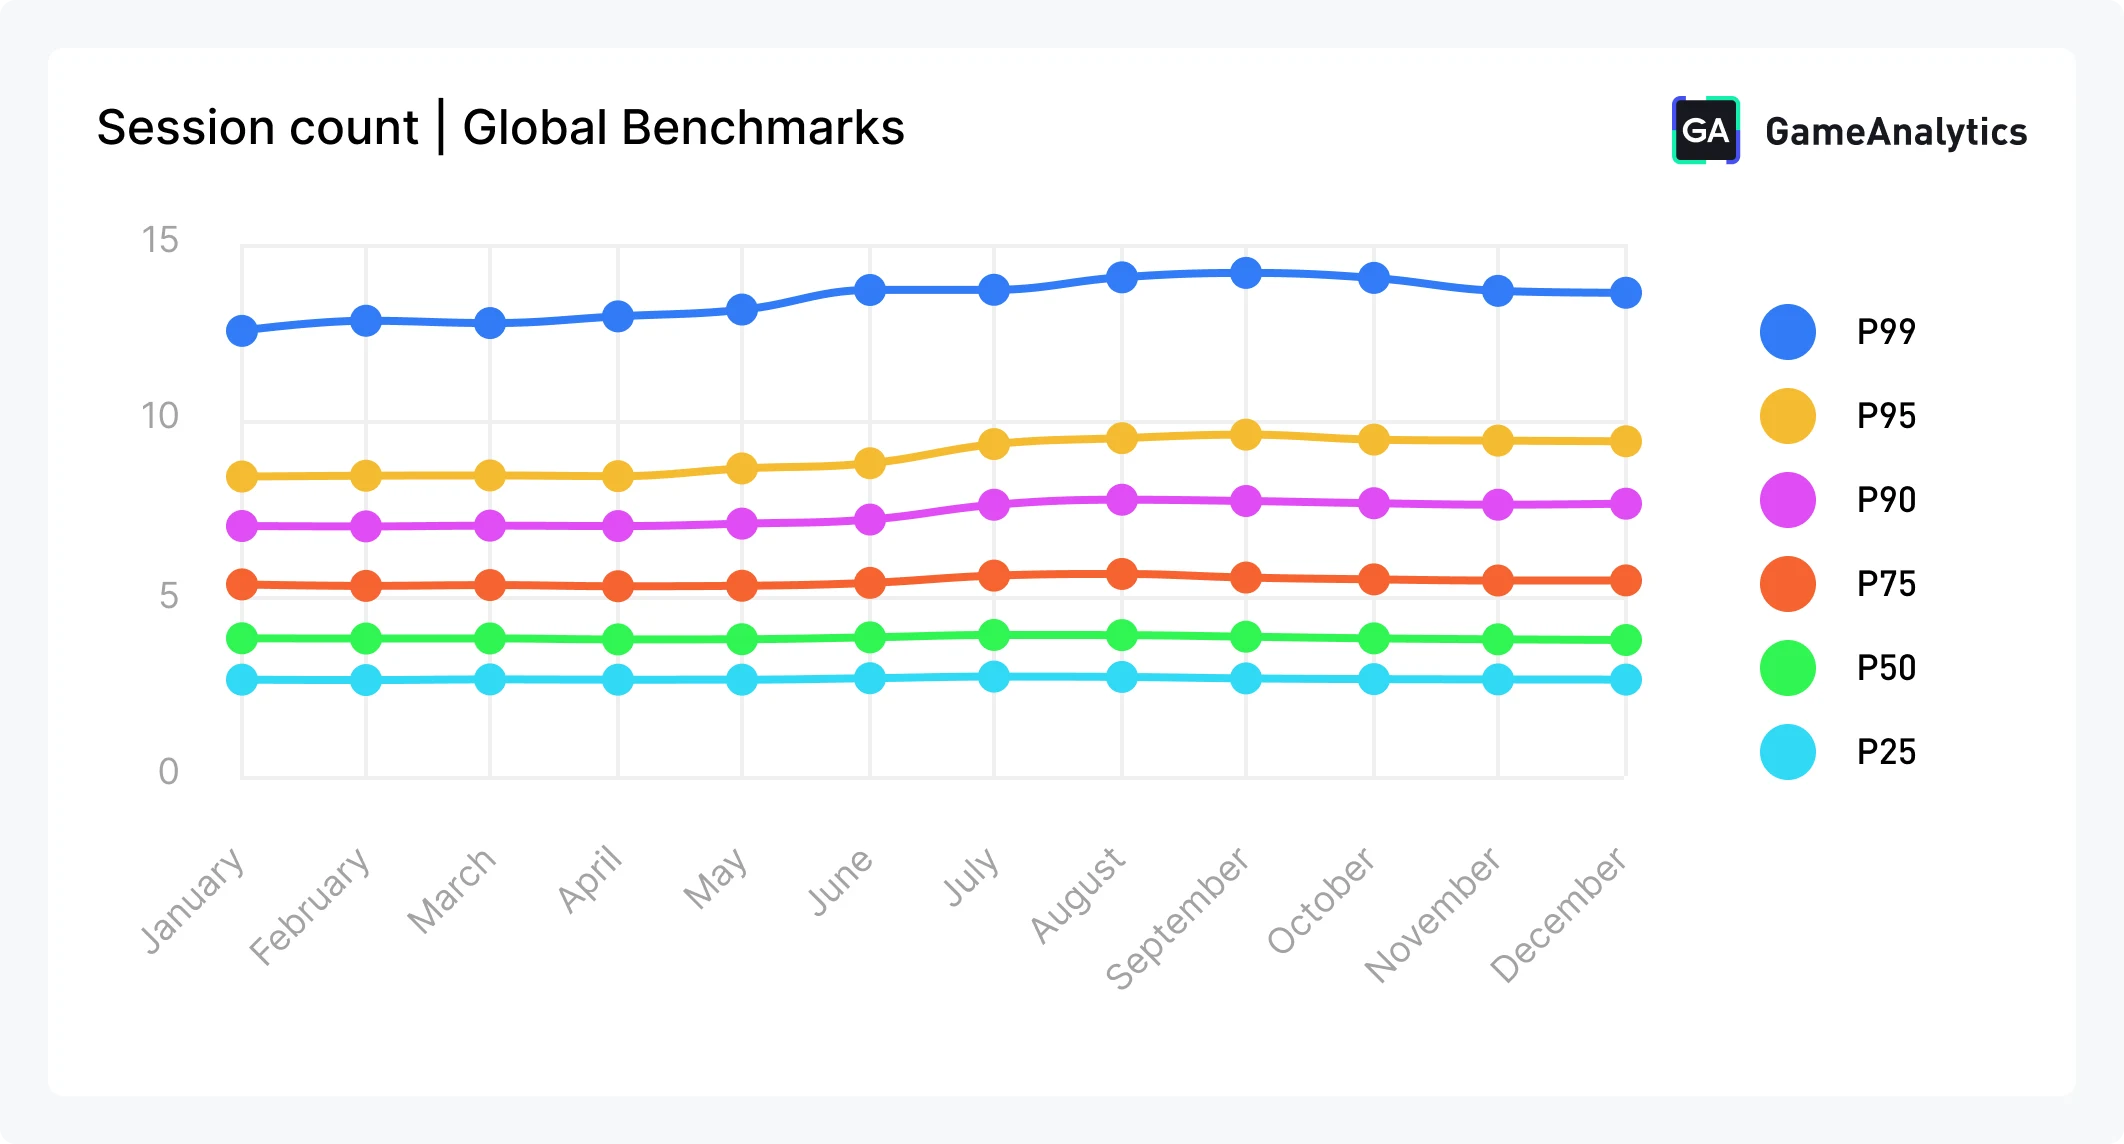
In 2025, session frequency remained stable and slightly lower than in previous years, reflecting a continued shift toward fewer, more intentional play sessions. Median games (P50) averaged between 3.8 and 3.9 sessions per day throughout the year. The bottom 25% of games (P25) consistently sat at 2.7 sessions per day, indicating limited repeat engagement within a single day.
Higher-performing games continued to stand out. The top 25% (P75) maintained around 5.3-5.7 daily sessions, while the top 10% (P90) reached nearly 9.6 sessions per day in some months. At the very top, the top 1% of games (P99) regularly exceeded 12 daily sessions, peaking above 14 sessions, highlighting how a small group of games successfully drive frequent check-ins through strong loops, social mechanics, or live content.
Regional insights
In this chapter, we take the same core retention and engagement metrics (D1, D7, D30 retention, playtime, session length, and session count) and break them down by region to highlight how player behavior differs across markets.
All figures shown represent yearly averages of weekly data, providing a stable view of long-term regional trends rather than short-term fluctuations. To capture the full performance spectrum, metrics are presented across three percentiles: the median 50%, top 10%, and top 1% of games. This approach allows us to compare typical performance with that of the highest-performing titles, while maintaining consistency across regions.
By viewing these benchmarks through a regional lens, developers can better understand where engagement patterns diverge, identify markets with distinct player behaviors, and contextualize their own performance against regional standards.
Retention
D1 Retention
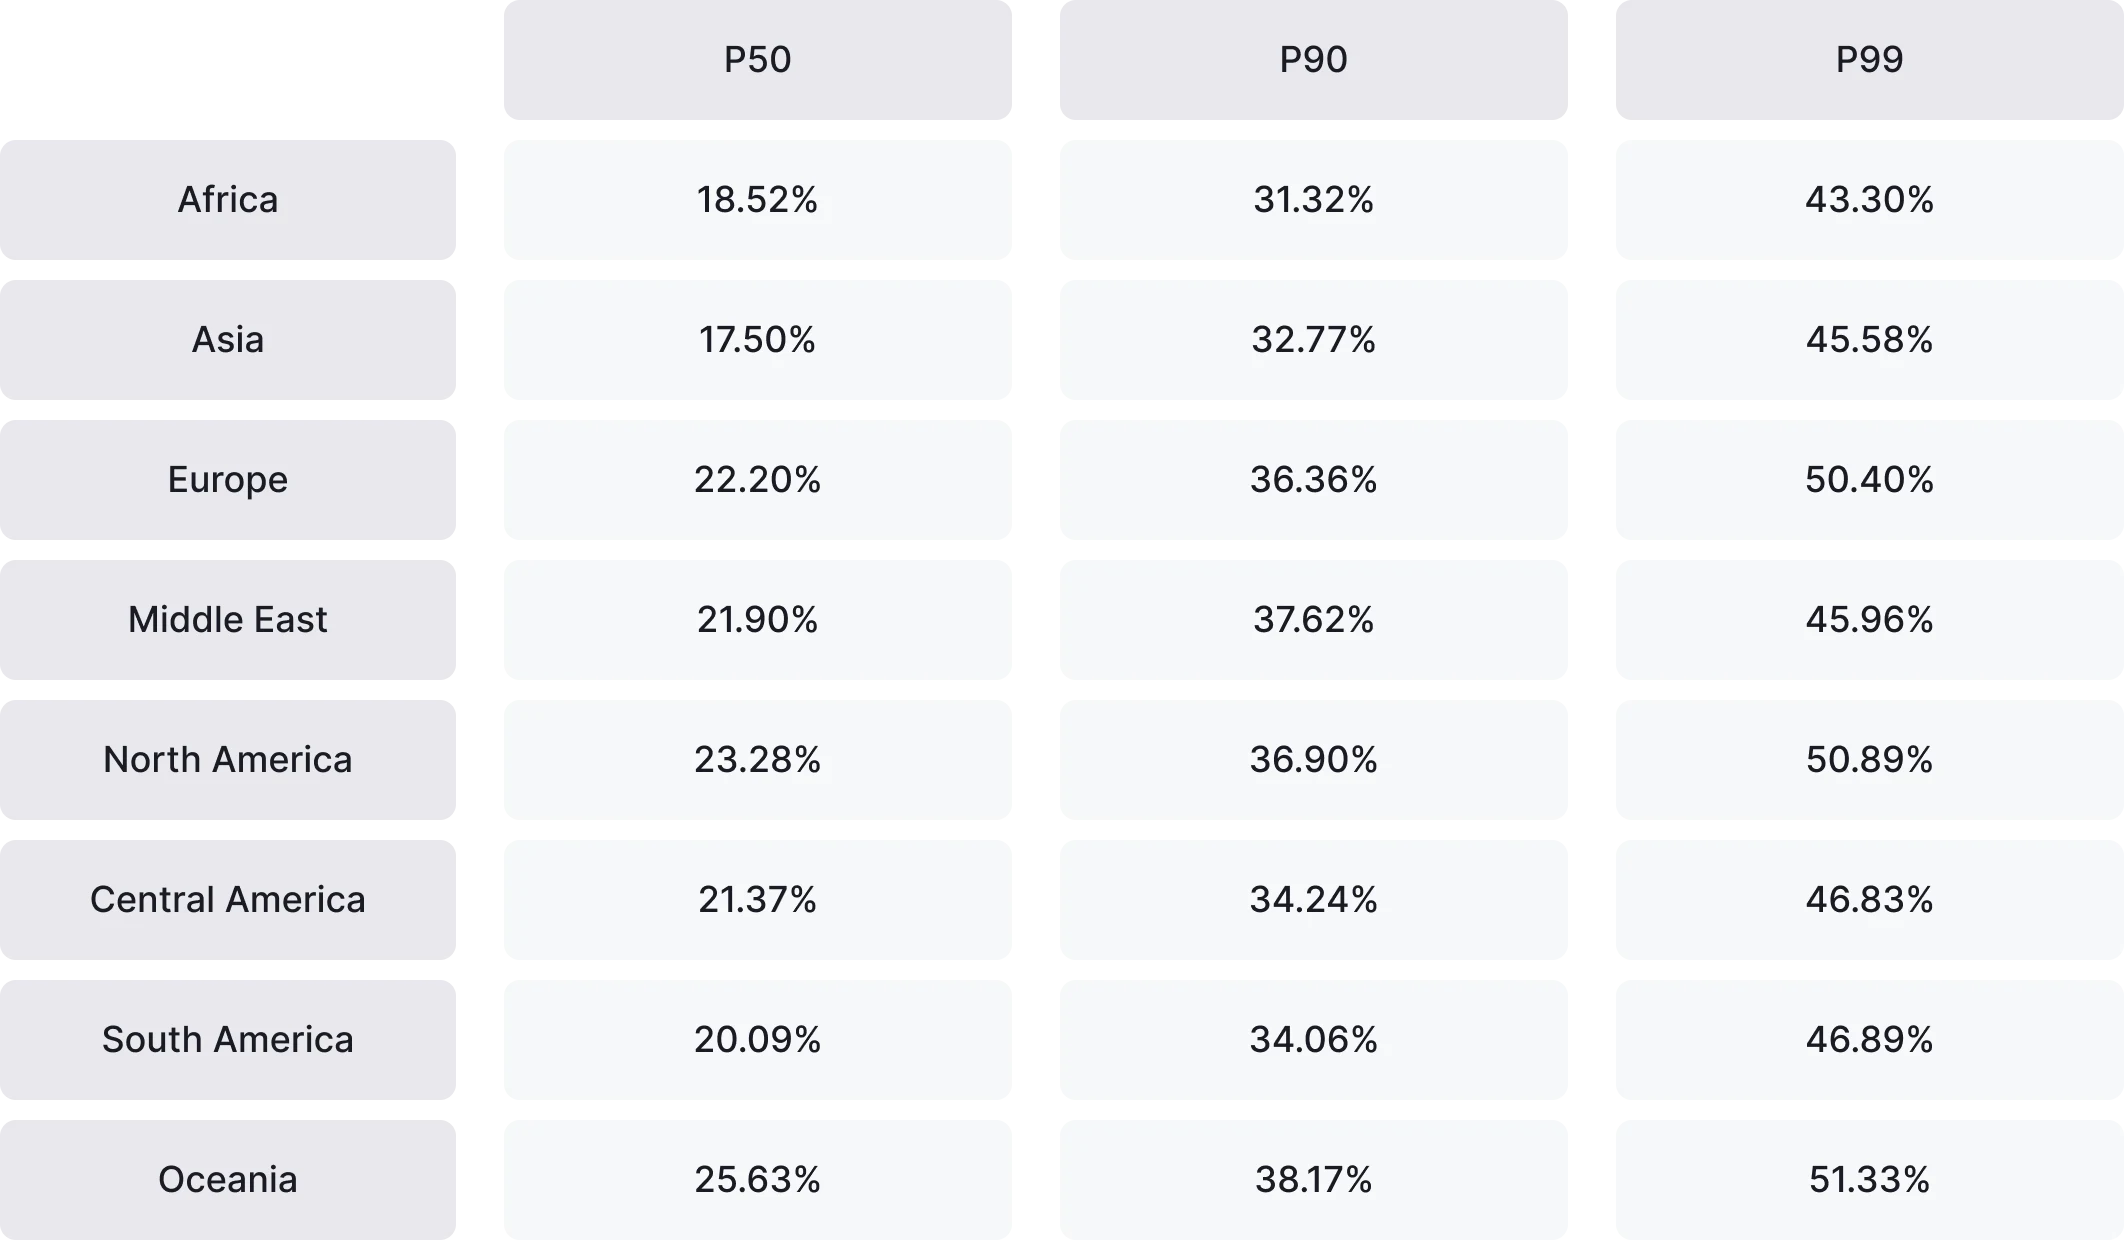
Day 1 retention shows clear regional differences under the refined methodology, with Western markets leading on early engagement. Oceania stands out at the median level (25.63%), followed by North America (23.28%) and Europe (22.20%), while Asia and Africa trail slightly below 19%, reflecting tougher early engagement dynamics.
At the top end, performance converges across regions. The top 10% of games (P90) reach 31-38% D1 retention, and the top 1% (P99) exceed 45% in every region, peaking above 50% in Oceania, North America, and Europe. This reinforces that while regional baselines vary, standout early engagement is achievable globally through strong onboarding and first-session design.

D7 Retention
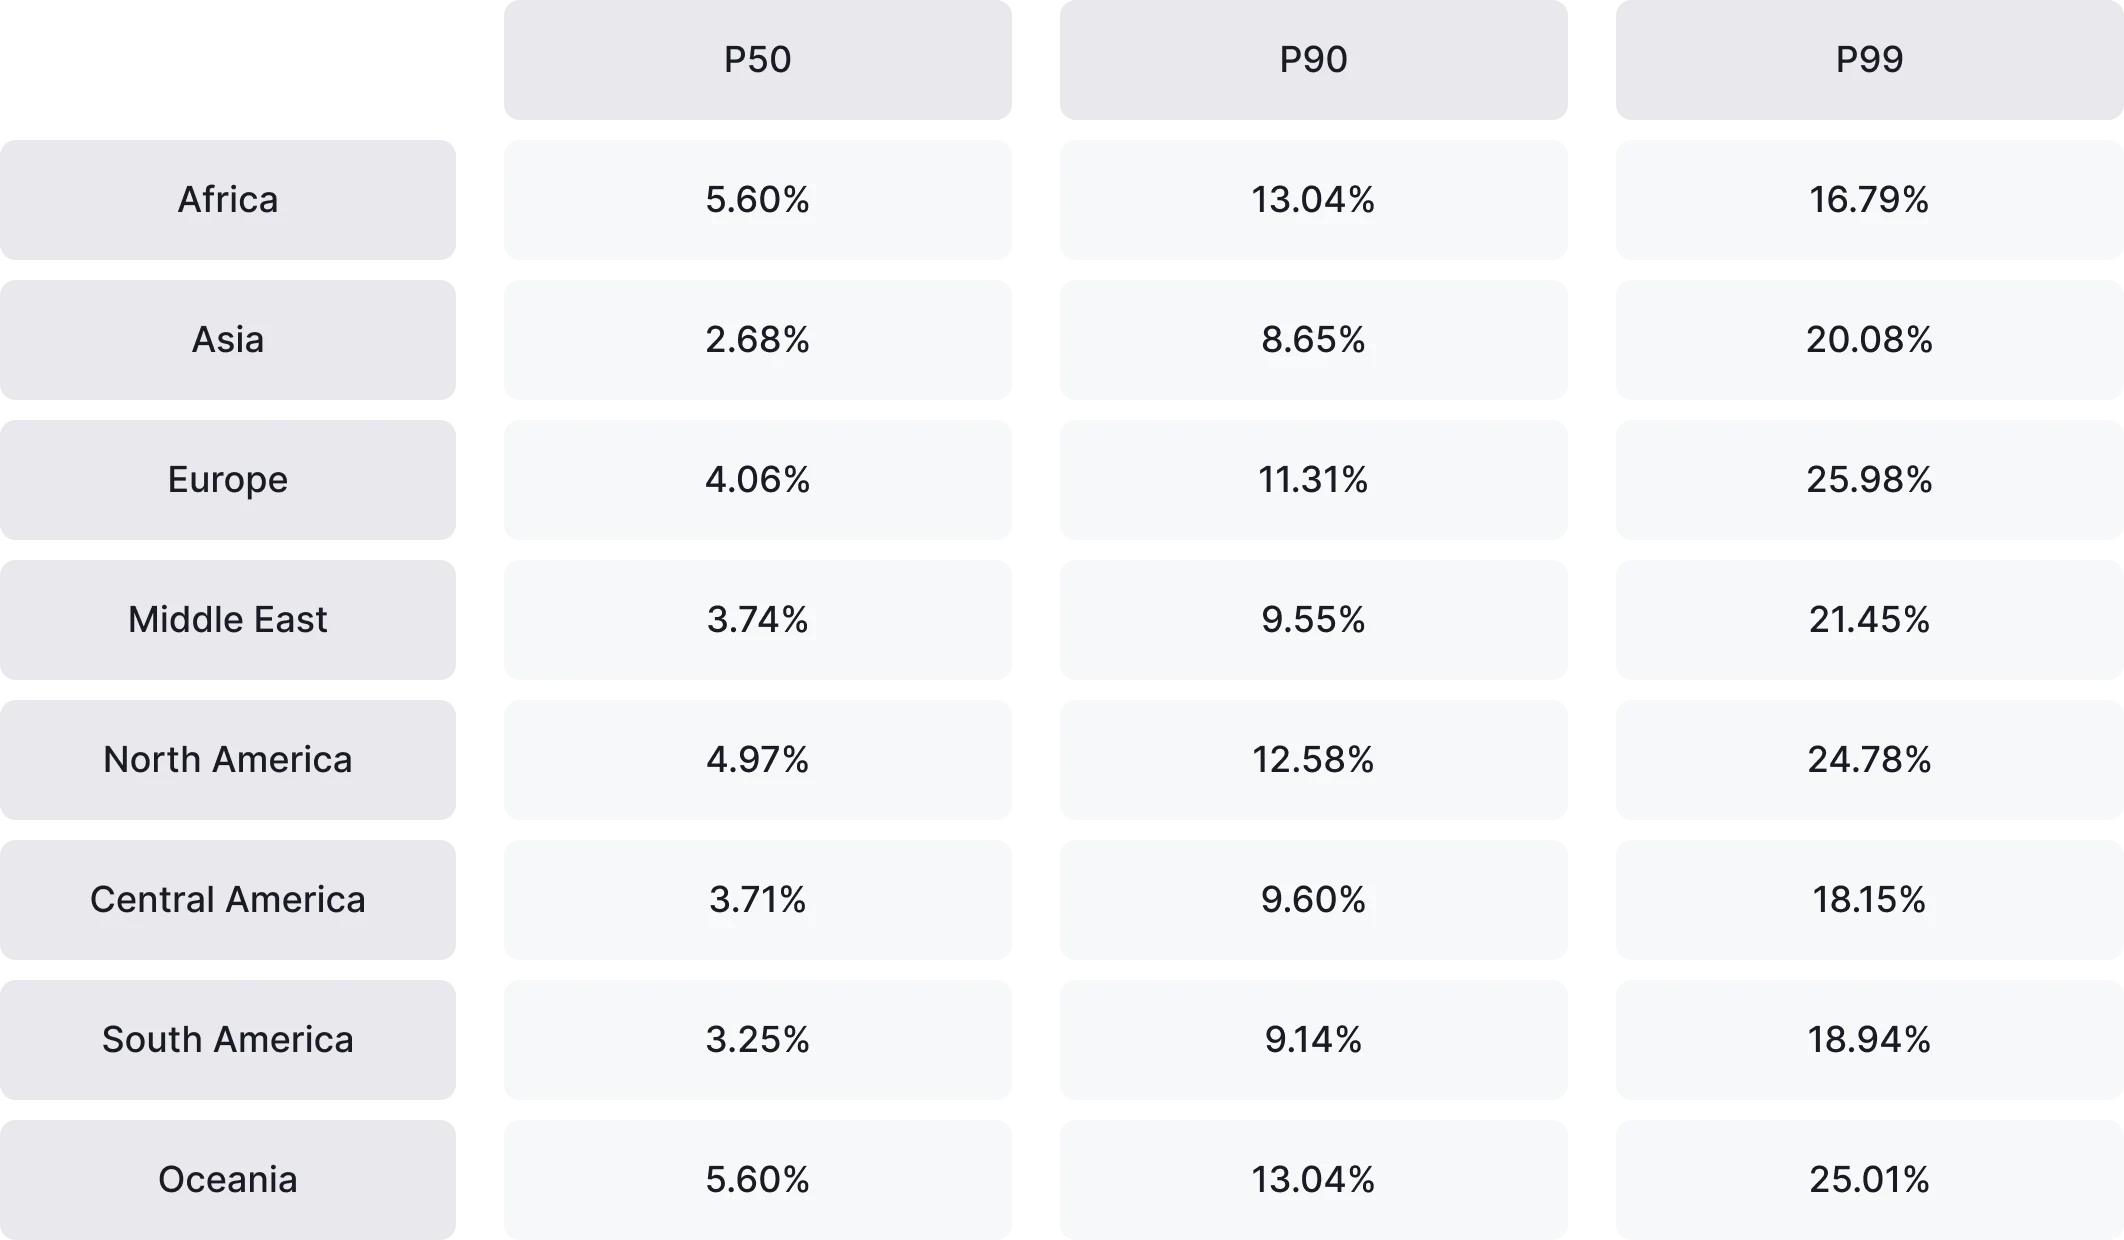
Day 7 (D7) retention shows stronger regional separation than D1, reflecting meaningful differences in mid-term engagement. At the median level (P50), Africa and Oceania lead at 5.60%, followed by North America (4.97%) and Europe (4.06%). Asia trails significantly at 2.68%, while South and Central America remain below 3.8%, indicating a steeper drop-off after the first week in these regions.
At the top end, the gap narrows across markets. The top 10% of games (P90) reach 12-13% D7 retention in Africa, Oceania, and North America, while Europe follows closely at 11.31%. Among the very top performers, the top 1% (P99) exceed 25% D7 retention in Africa, Oceania, and Europe, reinforcing that strong mid-term engagement is achievable globally, but remains concentrated among a small set of standout titles.
D30 Retention
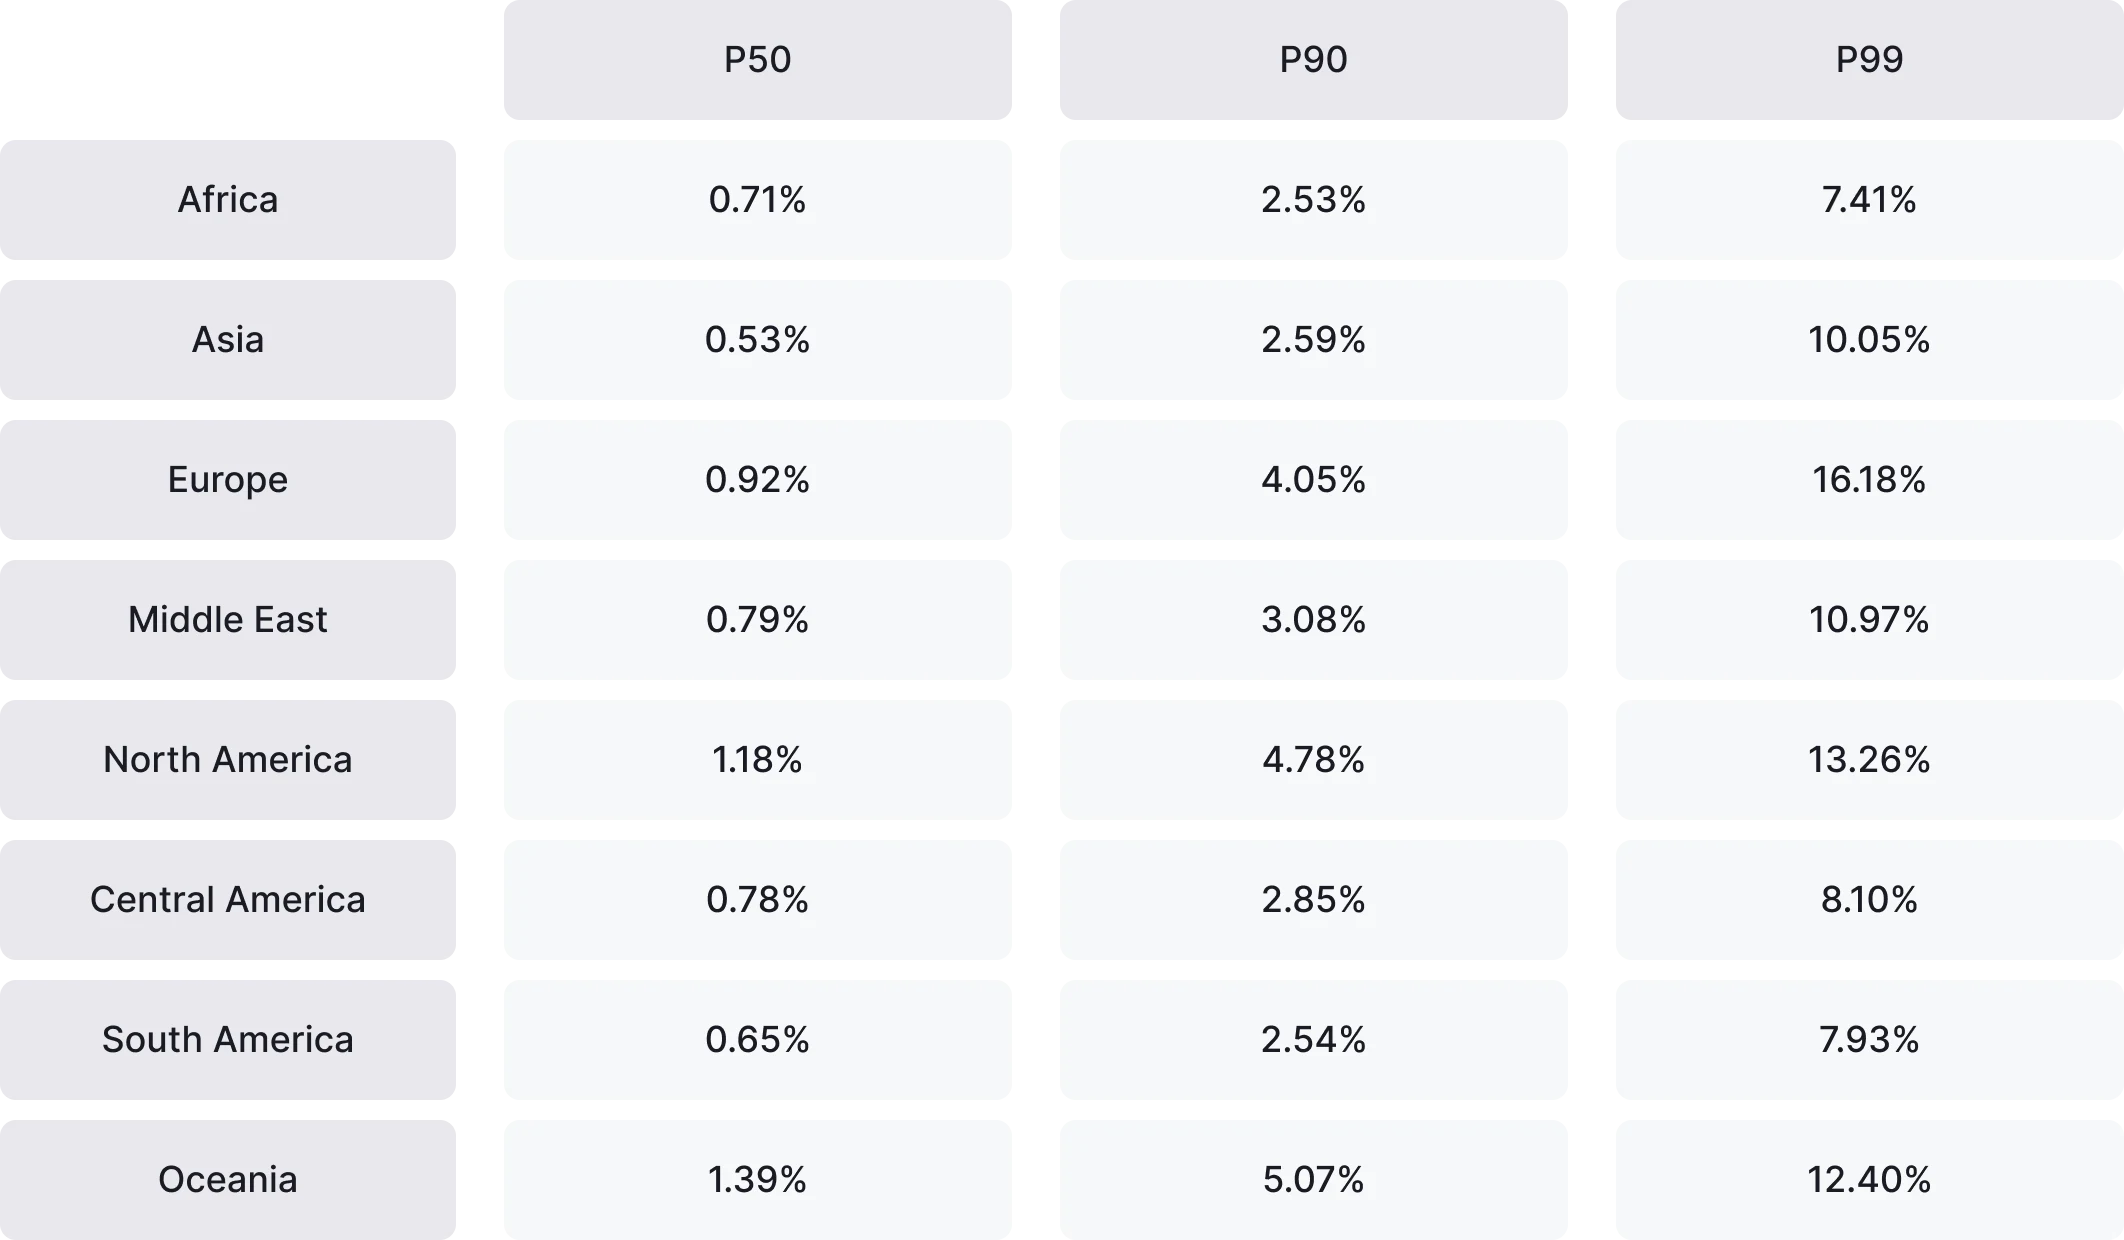
Day 30 (D30) retention shows the clearest regional divergence, highlighting where games are most successful at sustaining long-term engagement. At the median level (P50), Oceania leads at 1.39%, followed by North America (1.18%) and Europe (0.92%), while most other regions cluster between 0.5% and 0.8%. These figures reinforce how difficult it is to retain players beyond the first month, even in stronger-performing markets.
At the high end, differences become more pronounced. The top 10% of games (P90) exceed 4% D30 retention in Oceania, North America, and Europe, while other regions remain closer to 2.5-3%. Among the very top performers, the top 1% (P99) reach 16.18% in Europe and exceed 12% in Oceania and North America, demonstrating that durable long-term engagement is achievable globally, but remains concentrated among a small group of exceptional games.


Engagement
Playtime
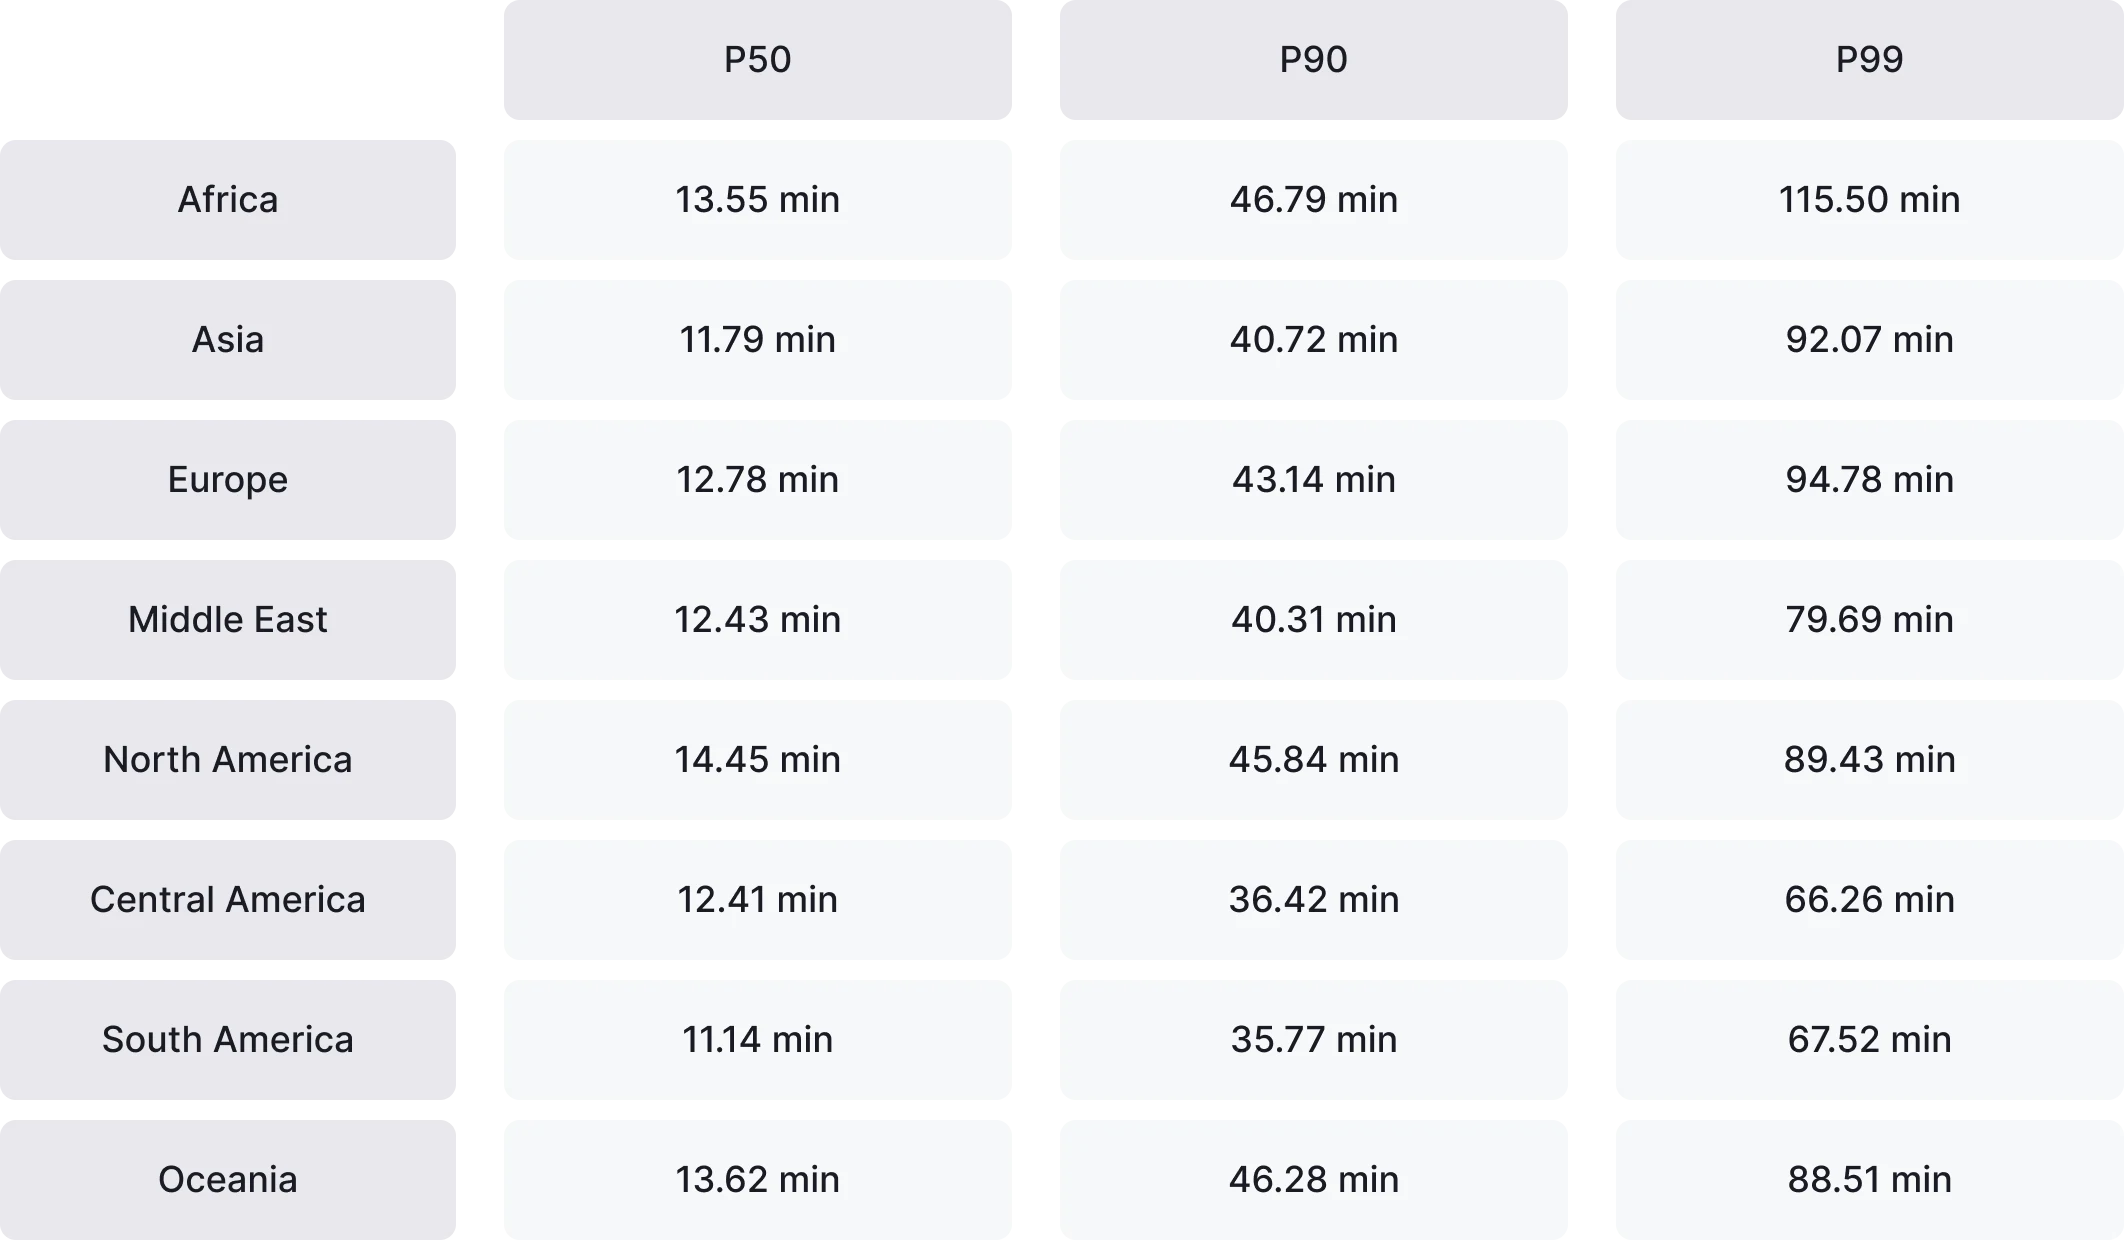
Daily playtime remains relatively consistent across regions at the median level, with most markets clustering between 11 and 14 minutes per day. North America leads at the median with 14.45 minutes, followed by Oceania (13.62 minutes) and Africa (13.55 minutes), while South America and Asia sit at the lower end, closer to 11-12 minutes, reflecting lighter average daily engagement.
Differences become more pronounced among higher-performing games. The top 10% (P90) reach 40-47 minutes of daily playtime across most regions, with Africa, North America, and Oceania at the upper end. At the extreme, the top 1% (P99) exceed 90 minutes of daily playtime in several regions, peaking at over 115 minutes in Africa, reinforcing that a small subset of games captures a disproportionate share of player attention globally.
Session length
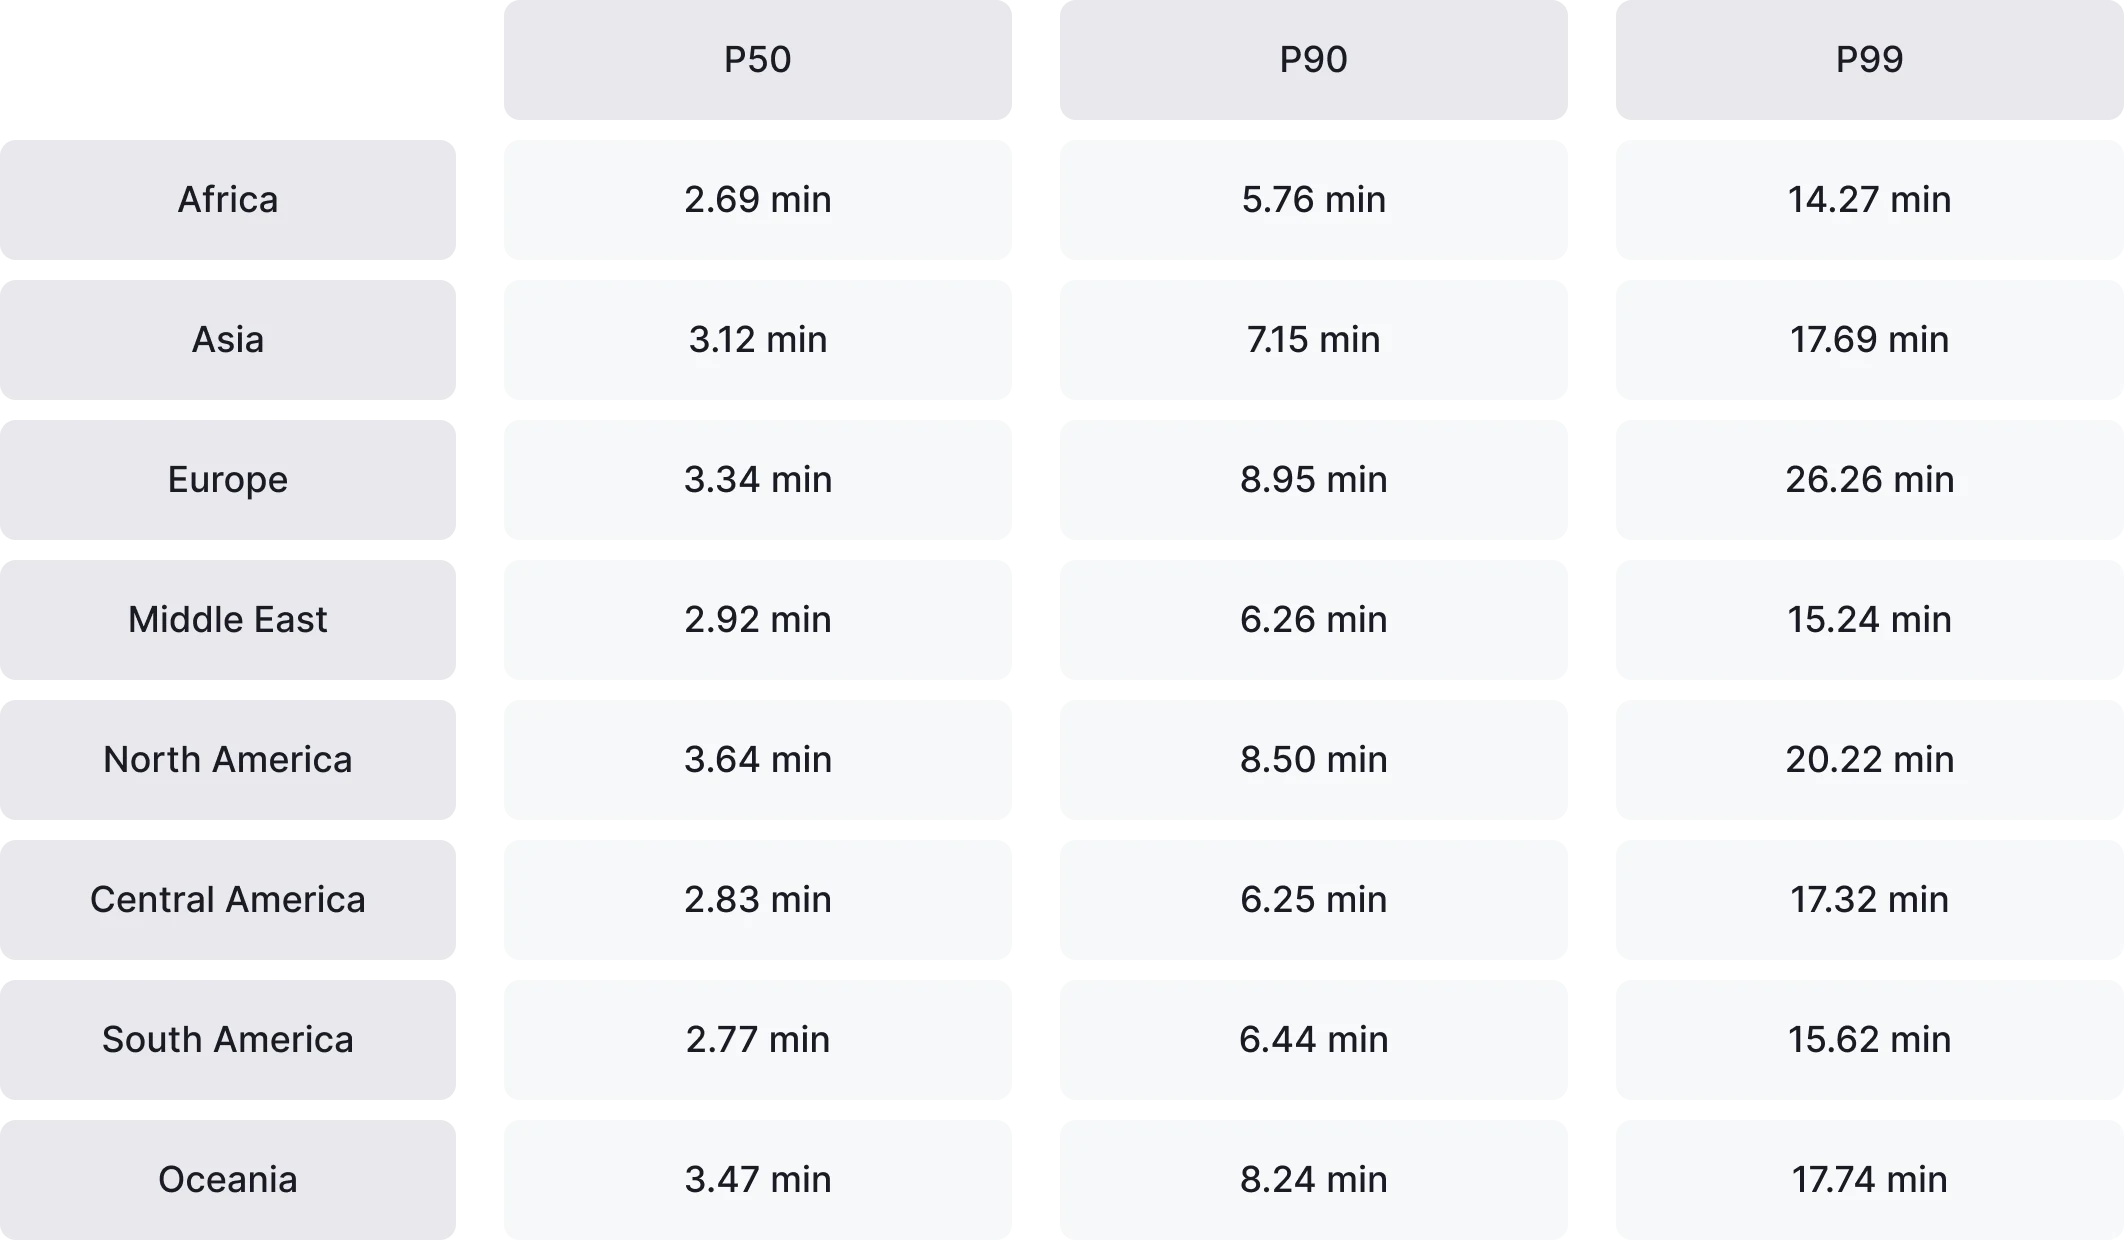
Session length remains broadly consistent at the median level across regions, clustering between 2.7 and 3.6 minutes per session. North America (3.64 min) and Oceania (3.47 min) lead slightly, followed by Europe (3.34 min), indicating a tendency toward longer single-session engagement in these markets. Other regions remain close to the global norm, suggesting similar baseline session behavior worldwide.
Differences become more pronounced among higher-performing games. The top 10% (P90) range from 6 to nearly 9 minutes per session, with Europe (8.95 min), North America (8.50 min), and Oceania (8.24 min) at the upper end. At the extreme, the top 1% (P99) show significantly deeper engagement, peaking at over 26 minutes per session in Europe and exceeding 20 minutes in North America, reinforcing that extended, immersive sessions are achievable across regions.
Session count
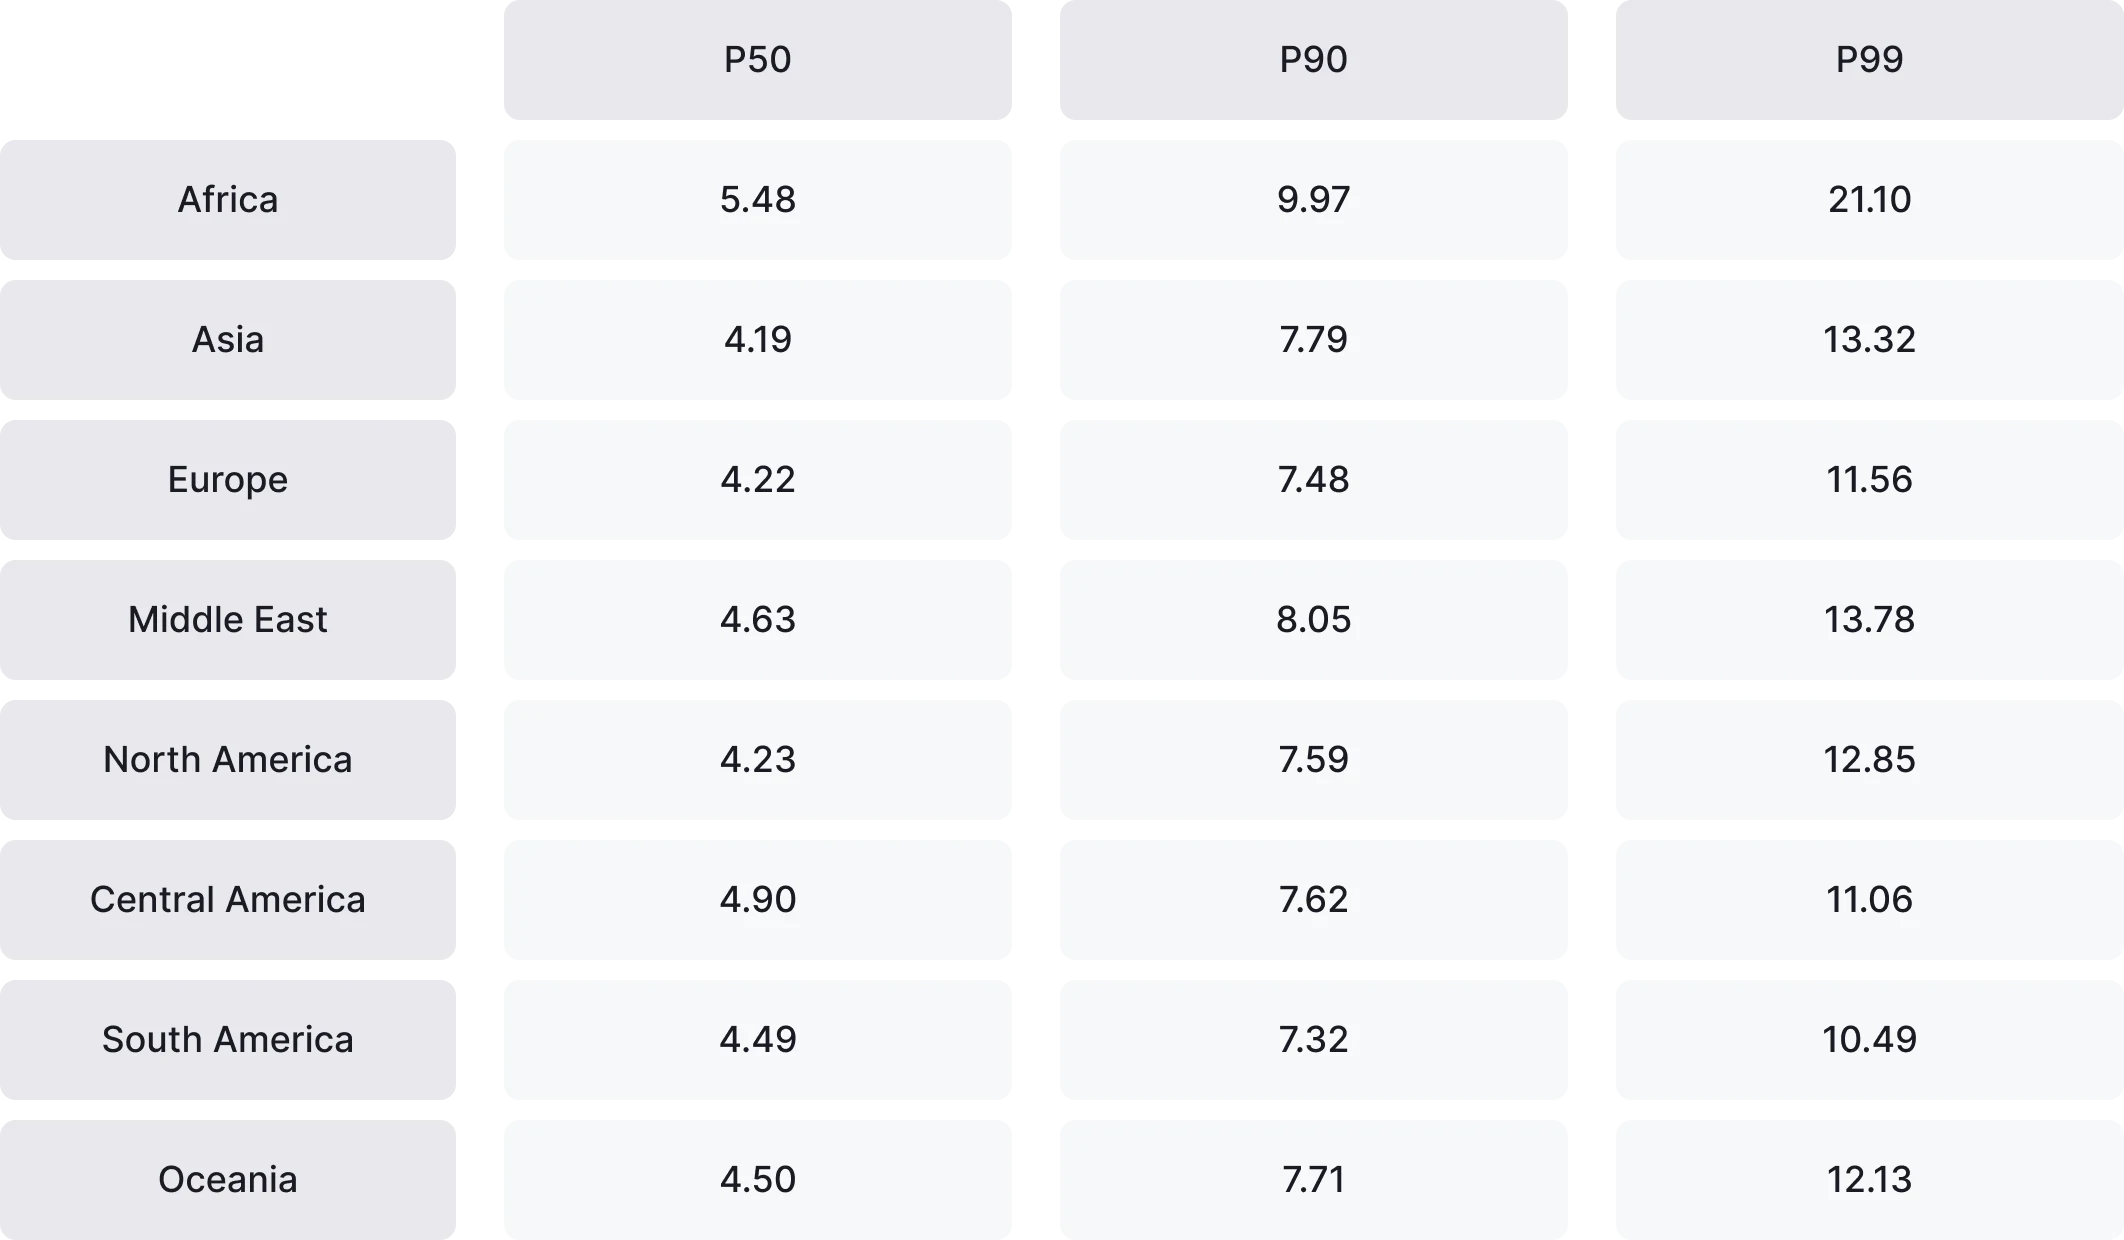
Session count shows clearer regional variation than session length, reflecting differences in how frequently players return within a single day. At the median level (P50), Africa leads with 5.48 daily sessions, standing out from other regions, which largely cluster between 4.2 and 4.9 sessions. This suggests higher habitual check-in behavior in Africa, while most regions display more moderate daily engagement frequency.
Among higher-performing games, regional differences narrow. The top 10% (P90) reach roughly 7.5-10 sessions per day across regions, with Africa again at the upper end. At the extreme, the top 1% (P99) show sharper divergence: Africa exceeds 21 sessions per day, while most other regions range between 10 and 14 sessions, indicating that highly habitual play is achievable globally, but most pronounced in specific markets.
2026 PC Gaming Benchmarks
PC games remain a cornerstone of the global games industry. They set the benchmark for depth, immersion, and longevity, and continue to shape player expectations around quality, content scope, and technical excellence. From premium single-player experiences to live-service multiplayer titles, PC is where long-form engagement, competitive ecosystems, and community-driven innovation thrive.
As the PC market evolves, access to reliable performance data becomes increasingly important. Player behavior on PC is shaped by longer sessions, varied play patterns, and distinct lifecycle dynamics: from major launches to post-release updates and expansions. Understanding how games perform across metrics such as retention, playtime, and session behavior is important not only for evaluating success but also for making informed decisions about content cadence, live operations, and long-term support.
These PC benchmarks are designed to provide that clarity. Drawing on aggregated data from over 3,500 PC games live in 2025, this report provides a point of reference for developers building for PC.
Key Highlights
PC engagement is depth-driven, not frequency-driven
Most PC games generate meaningful engagement through longer play sessions rather than frequent daily check-ins, reinforcing that session length and playtime are more indicative of success than daily habit metrics alone.
Retention reflects content longevity, not daily return behavior
D1, D7, and D30 retention rates are low in absolute terms but consistent across the market, highlighting that PC retention should be interpreted as a measure of how long players continue engaging with content rather than how often they return.
A small group of games captures a disproportionate share of engagement
Across playtime, session length, DAU-to-MAU, and new users, top-performing PC titles significantly outperform the median, underscoring how live-service design, replayability, and community features drive outsized results.
Engagement rhythm varies widely across PC games
Some titles rely on deep, infrequent sessions, while others succeed through repeated returns across days, making it essential to evaluate session count and DAU-to-MAU together rather than in isolation.
Player inflow alone does not guarantee long-term success
High volumes of new users often coincide with launch or promotional spikes, but only games that pair acquisition with strong engagement metrics convert attention into sustained performance.
Methodology
To ensure the PC benchmarks accurately reflect live, player-facing experiences, we applied a stricter set of filters than in the mobile analysis. PC games typically have longer development and testing cycles, with extended pre-release phases that can distort engagement metrics if included prematurely. For this reason, we focused exclusively on games that were live and actively played during 2025.
The dataset includes only games that contributed at least four months of data in 2025 and maintained a minimum of 100 Monthly Active Users (MAU). This approach excludes titles still in early testing, limited-access phases, or internal prototypes, ensuring the benchmarks represent games with sustained player activity. After applying these criteria, the final sample consisted of 3,582 PC games.
All PC benchmarks in this section are presented at a global level. Unlike the mobile analysis, we do not segment PC data by region, as engagement patterns on PC are more heavily influenced by game design, lifecycle stage, and content model than by geography.
The metrics analyzed in this section include retention, playtime, session length, session count, DAU vs. MAU, and new users. Together, these metrics provide a holistic view of how PC players engage with games over time, capturing both the depth of individual play sessions and broader engagement patterns across days and months.
This methodology balances data integrity with representativeness, providing PC developers with clear, comparable benchmarks that reflect real performance across a wide range of live PC titles.
Benchmarks
Retention
Retention in PC games reflects a different engagement model than on mobile. While mobile retention often measures how successfully a game becomes a daily habit, PC retention is more closely tied to content consumption, progression depth, and lifecycle design. Many PC games are designed for long, immersive sessions spread across fewer days, making lower day-based retention a natural outcome rather than a sign of underperformance.
In this context, retention should be interpreted as the time players continue to engage with a game after their first experience, not how frequently they return each day. It provides insight into whether players find enough value to progress through content, return for updates, or re-engage after major milestones such as expansions, seasonal updates, or multiplayer events.
The retention benchmarks presented in this section offer a global reference point for PC developers to understand typical engagement lifecycles across live games. When viewed alongside playtime, session length, and DAU-to-MAU ratios, retention helps paint a complete picture of how players commit to PC games over time.
D1 Retention
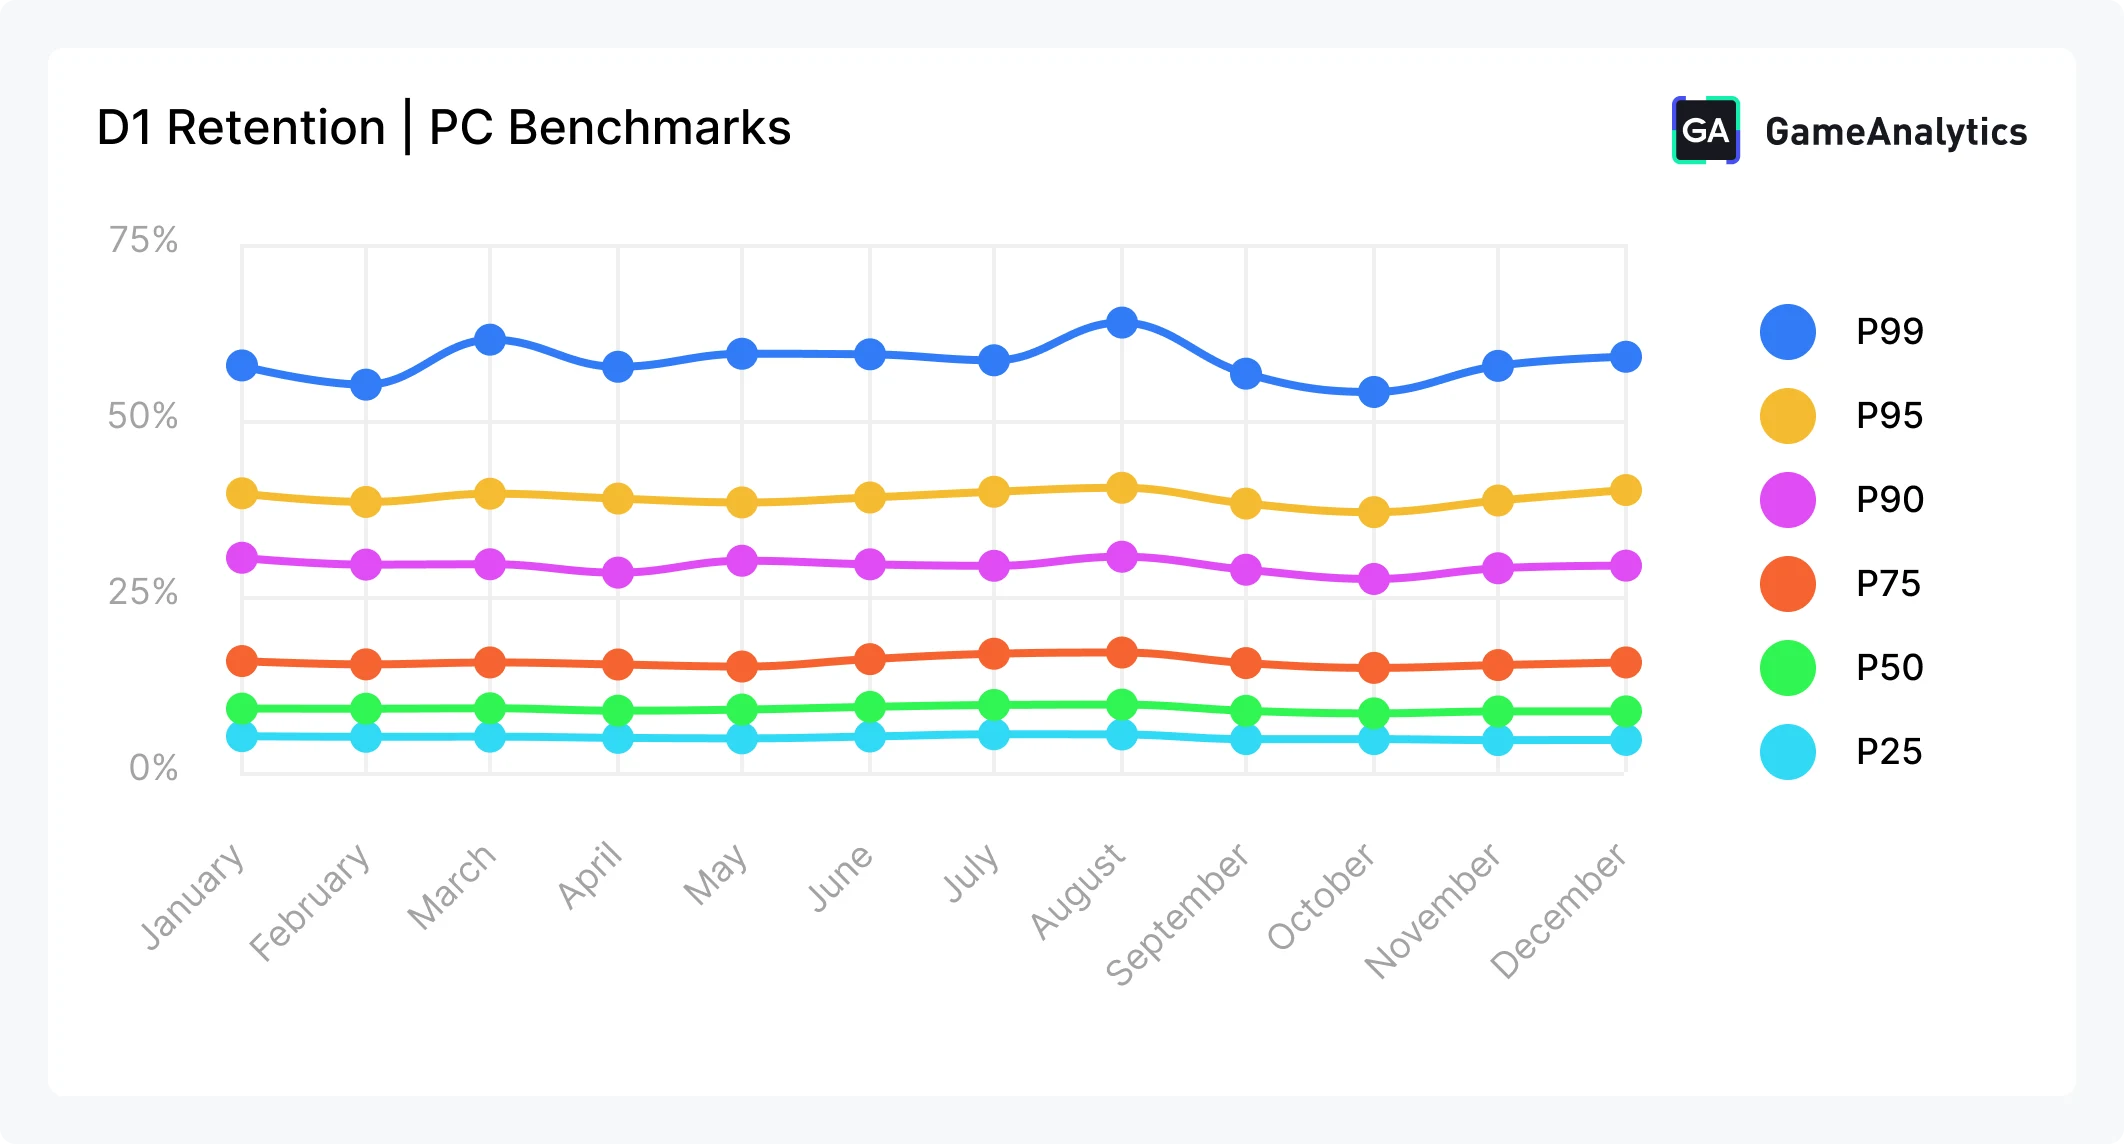
Day 1 retention on PC remains low in absolute terms, but highly stable across the year, reflecting the fundamentally different engagement patterns of PC games compared to mobile. Throughout 2025, median games (P50) consistently retained around 7% of players on Day 1, while the bottom 25% (P25) remained near 3%, indicating that many PC experiences are consumed in longer, less frequent sessions rather than daily returns.
Stronger-performing games show a clearer separation. The top 25% (P75) maintained D1 retention between 12% and 13%, while the top 10% (P90) hovered around 21-23% for most of the year. At the very top, the top 1% of games (P99) achieved 40-50% D1 retention, demonstrating that some PC titles, typically live-service, multiplayer, or highly replayable experiences, are still able to drive immediate re-engagement.
D7 Retention
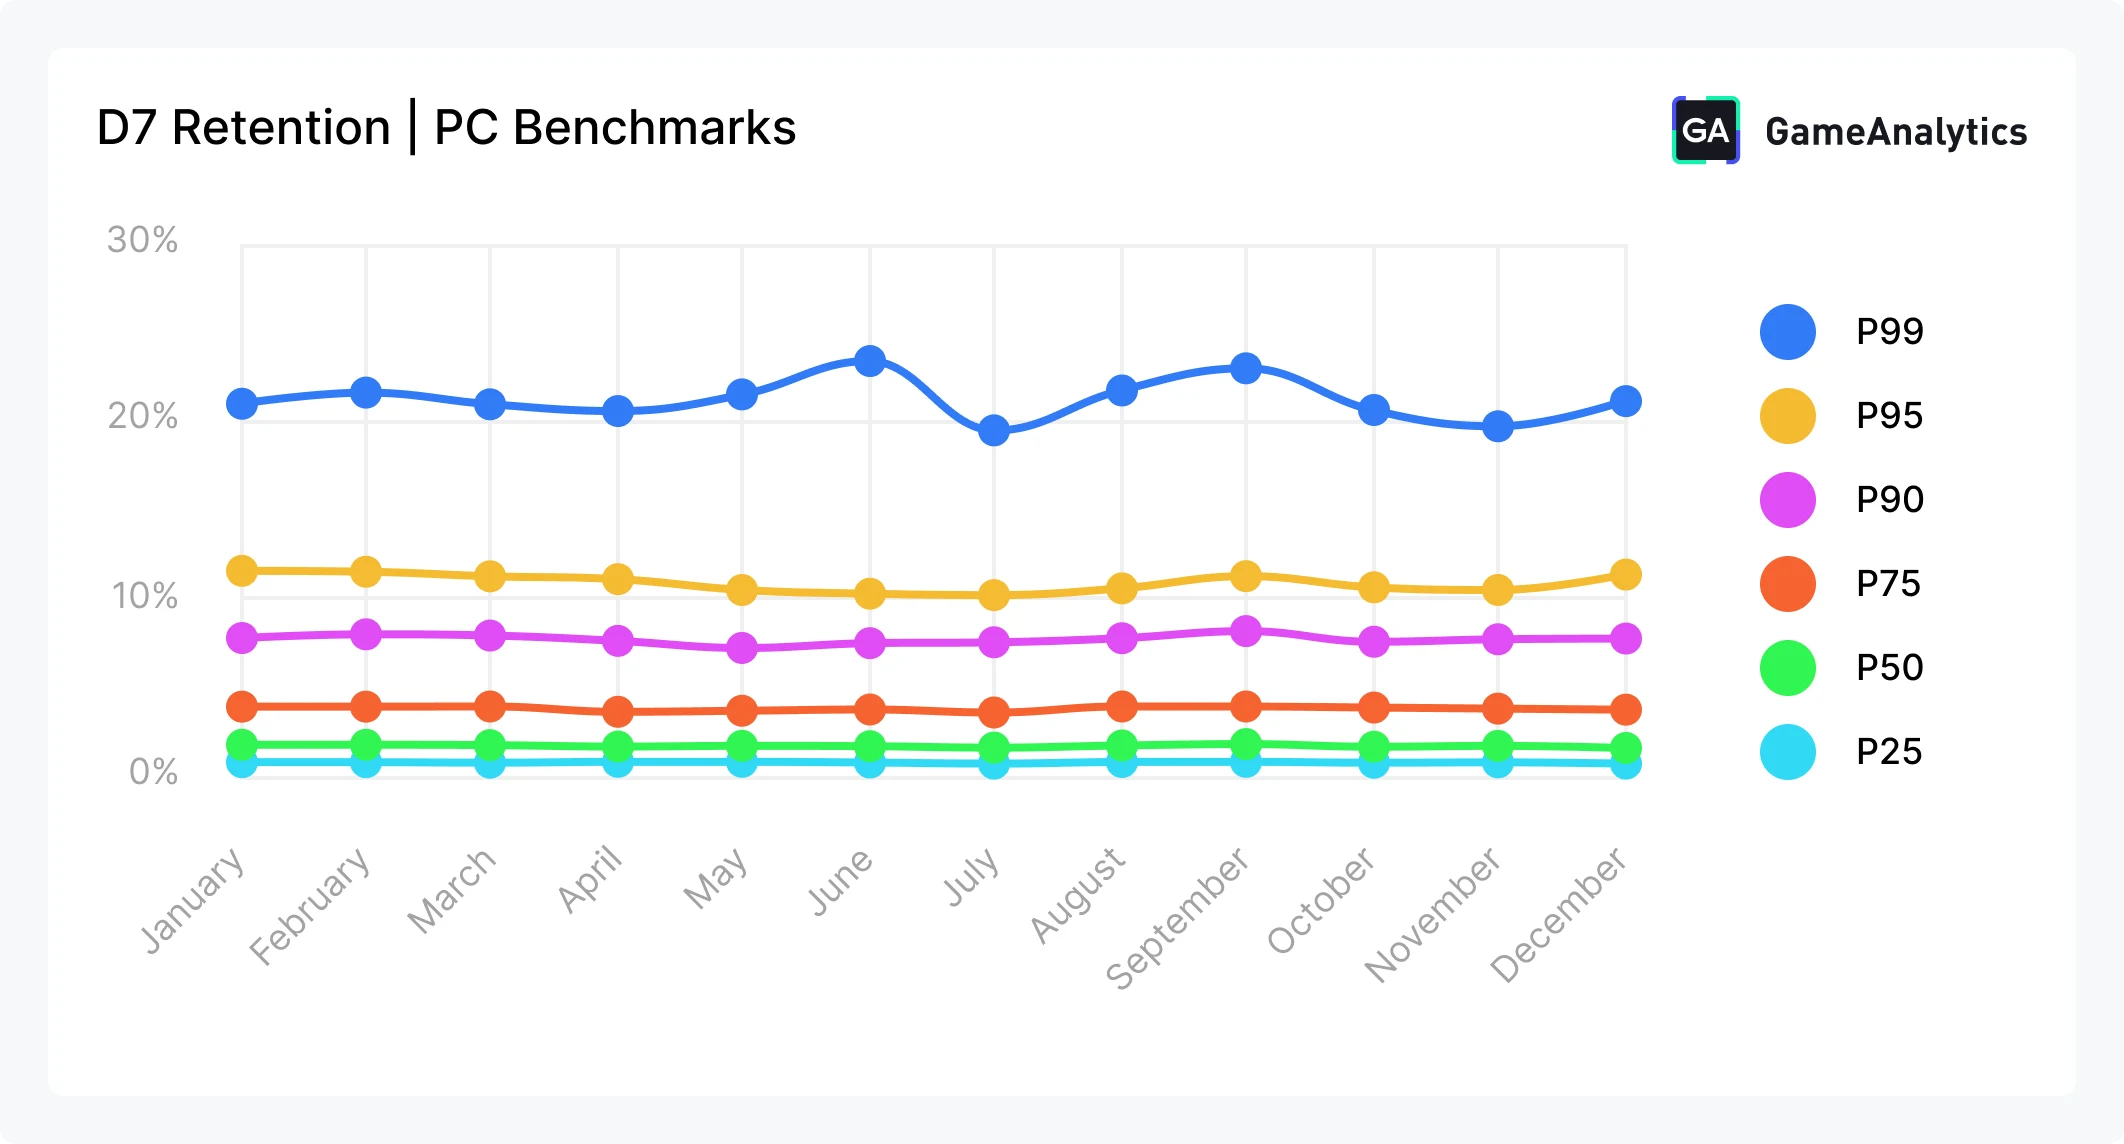
Day 7 retention on PC highlights how quickly engagement consolidates after the initial experience, reflecting the platform's content-driven, lifecycle-oriented nature. Throughout 2025, the median game (P50) retained roughly 1.1-1.3% of players by Day 7, with a slight softening toward the end of the year. The bottom 25% (P25) remained below 0.5%, underscoring how many PC games are consumed in short bursts around launch or initial play.
Higher-performing titles show a much clearer separation. The top 25% (P75) consistently achieved 2.7-3.2% D7 retention, while the top 10% (P90) maintained 5.8-6.9% across most months. At the extreme end, the top 1% of games (P99) achieved 18-27% D7 retention, demonstrating that a small subset of PC titles (often supported by multiplayer systems, live updates, or strong replayability) can sustain meaningful engagement beyond the first week.
On PC, D7 retention reflects whether players return to continue a longer-term experience or re-engage after their initial sessions, rather than indicating daily habit formation. When combined with playtime and session behavior, D7 retention helps reveal how durable a PC game’s engagement is once the early novelty fades.
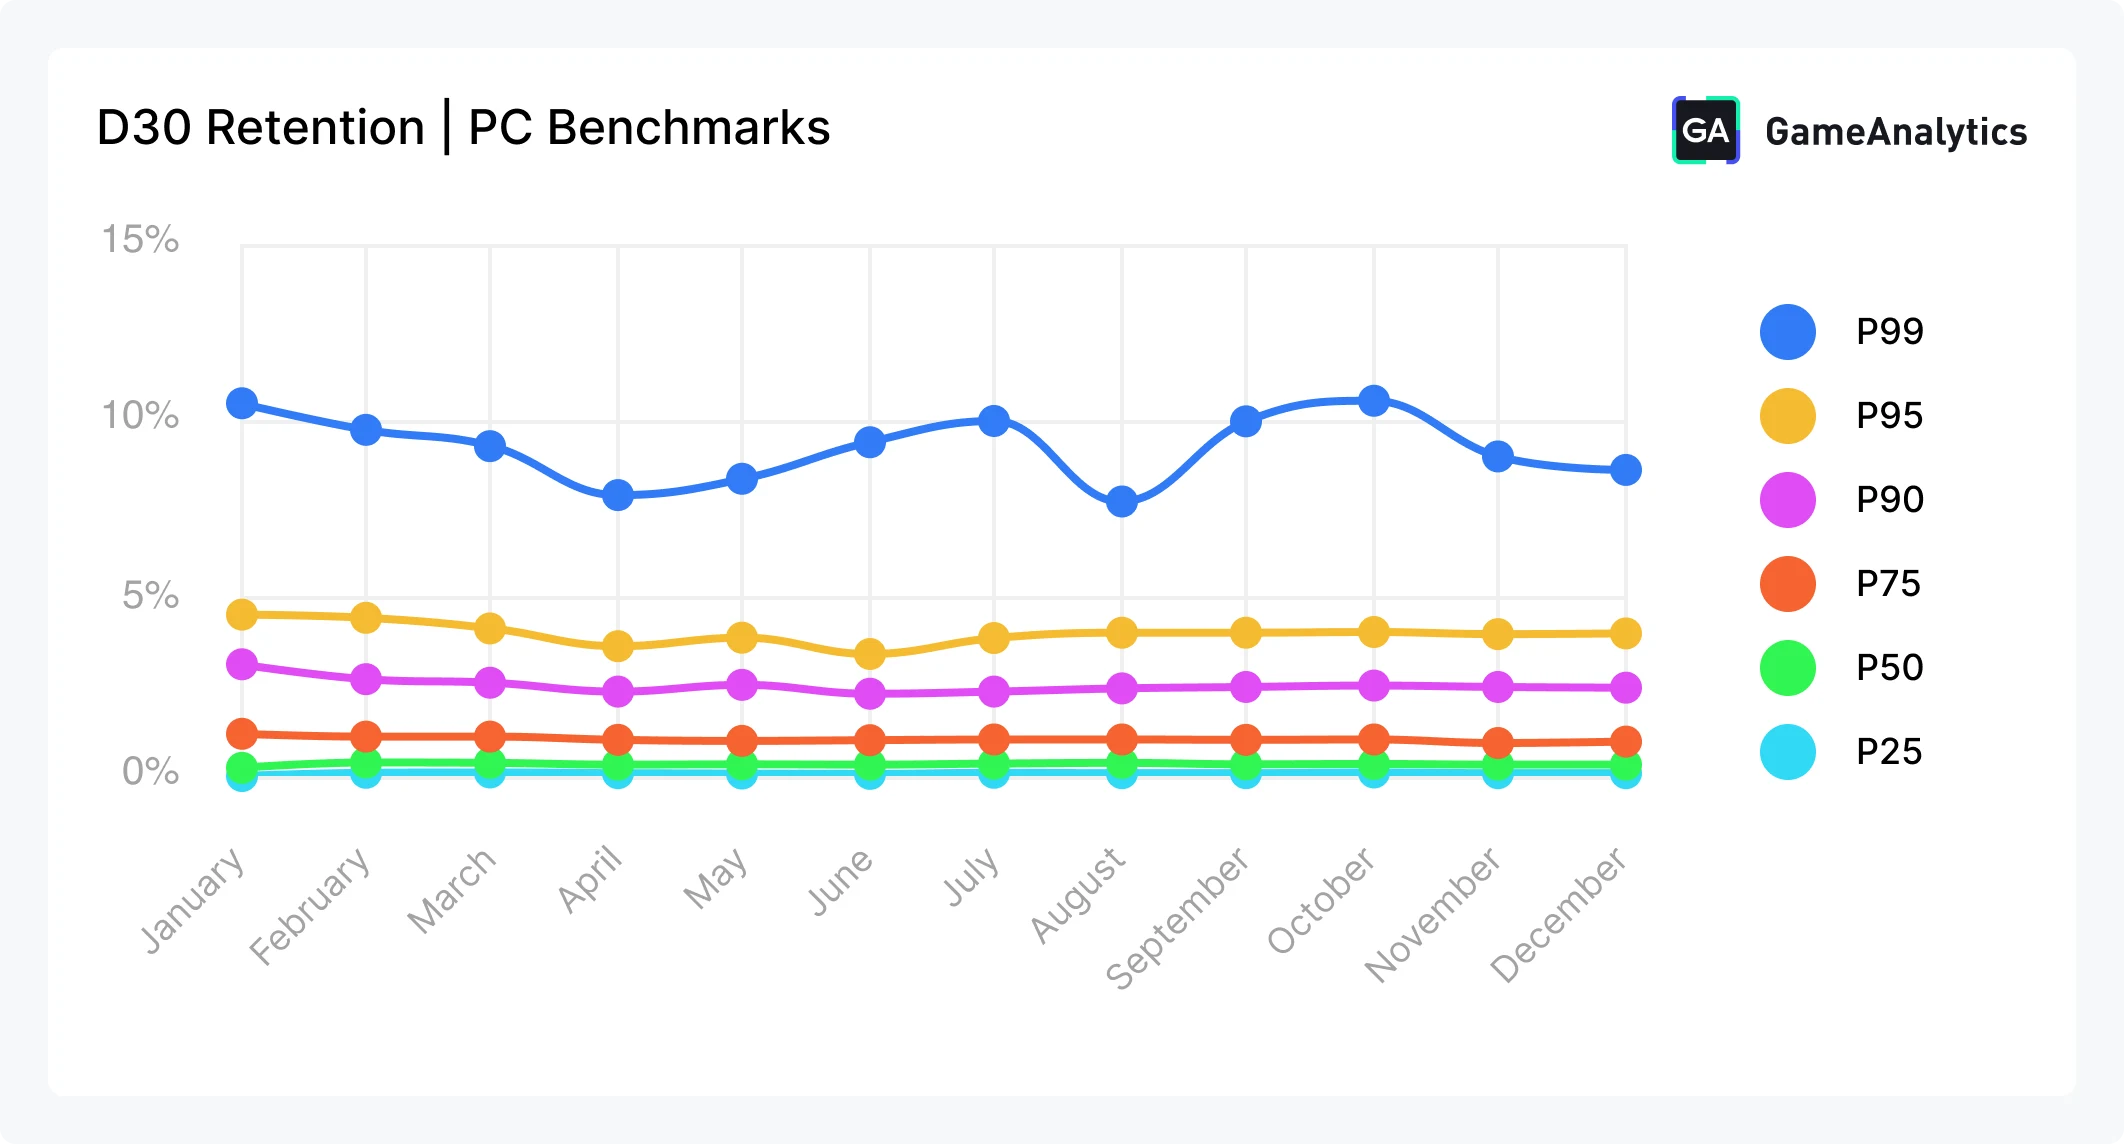
D30 Retention
Day 30 retention on PC underscores the steep drop-off that follows initial content consumption, reflecting the longer, more finite engagement cycles common to many PC games. Across 2025, the median game (P50) retained only ~0.2-0.25% of players by Day 30, while the bottom 25% (P25) consistently registered 0%, indicating that a large share of PC titles see little to no return engagement one month after first play.
Even among stronger performers, long-term retention remains difficult. The top 25% of games (P75) typically retained 0.7-0.9% of players by Day 30, while the top 10% (P90) clustered around 2% throughout the year. These figures highlight how rare sustained month-long engagement is outside of games built around live-service models, multiplayer systems, or ongoing content delivery.
At the top end, however, standout titles continue to differentiate themselves. The top 1% of games (P99) achieved 10-16% D30 retention, particularly early in the year, demonstrating that durable long-term engagement is achievable, but limited to a very small subset of PC games.
Engagement
Playtime
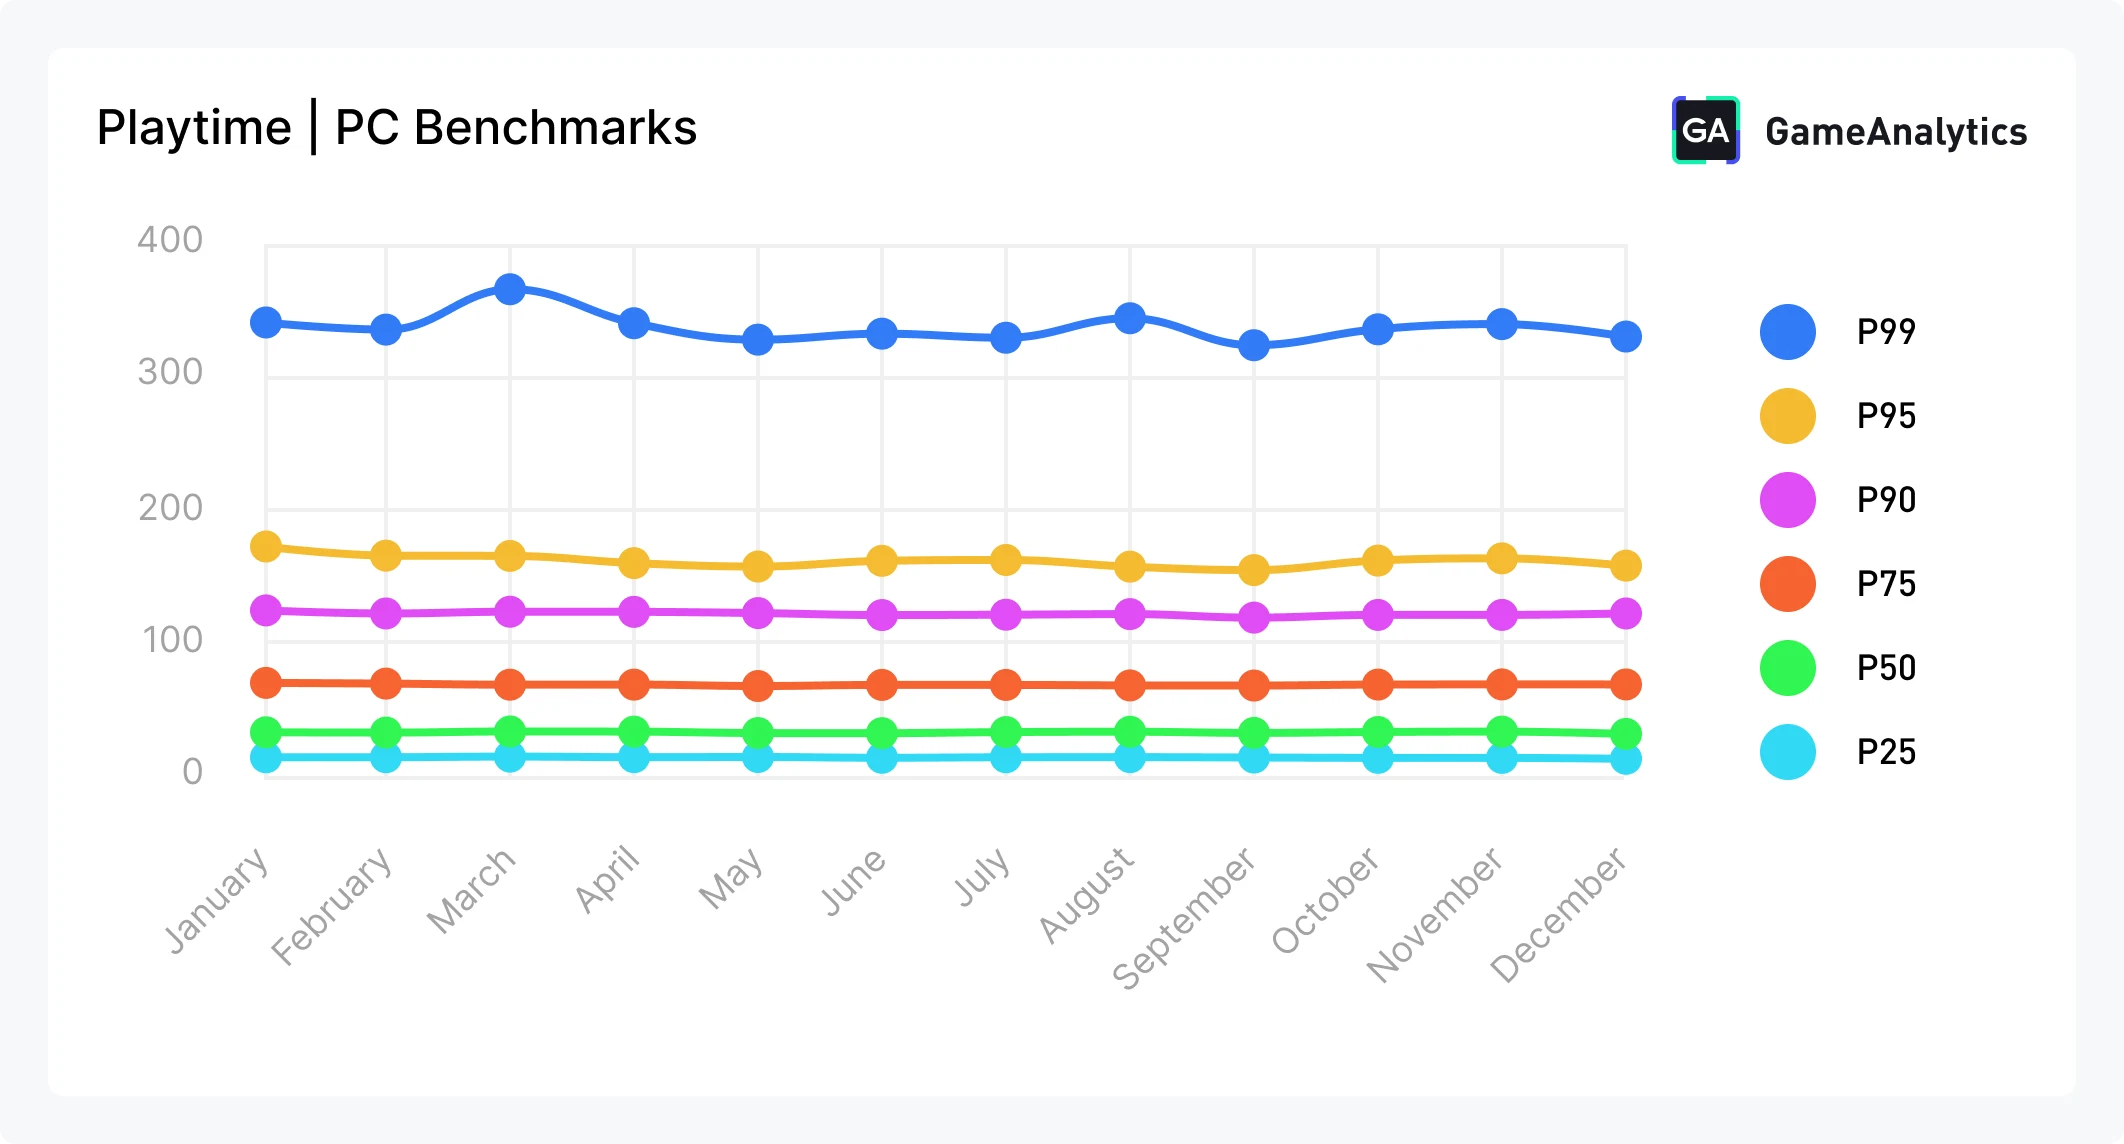
On PC, playtime reflects engagement depth. Players tend to engage in fewer, longer sessions driven by immersion, content scope, and intent, making playtime a strong signal of perceived value. High playtime can occur even when day-based retention is modest, particularly in narrative or content-rich experiences, and it explains how players engage when they return, offering essential context for understanding engagement quality on PC rather than return frequency alone.
In 2025, median daily playtime (P50) remained stable at around 32-33 minutes, while the top 25% (P75) averaged close to 70 minutes per day. Higher-performing titles stood out more clearly, with the top 10% (P90) exceeding 120 minutes of daily playtime and the top 1% (P99) reaching 300+ minutes, highlighting how a small group of PC games drive exceptionally deep engagement.
Session length
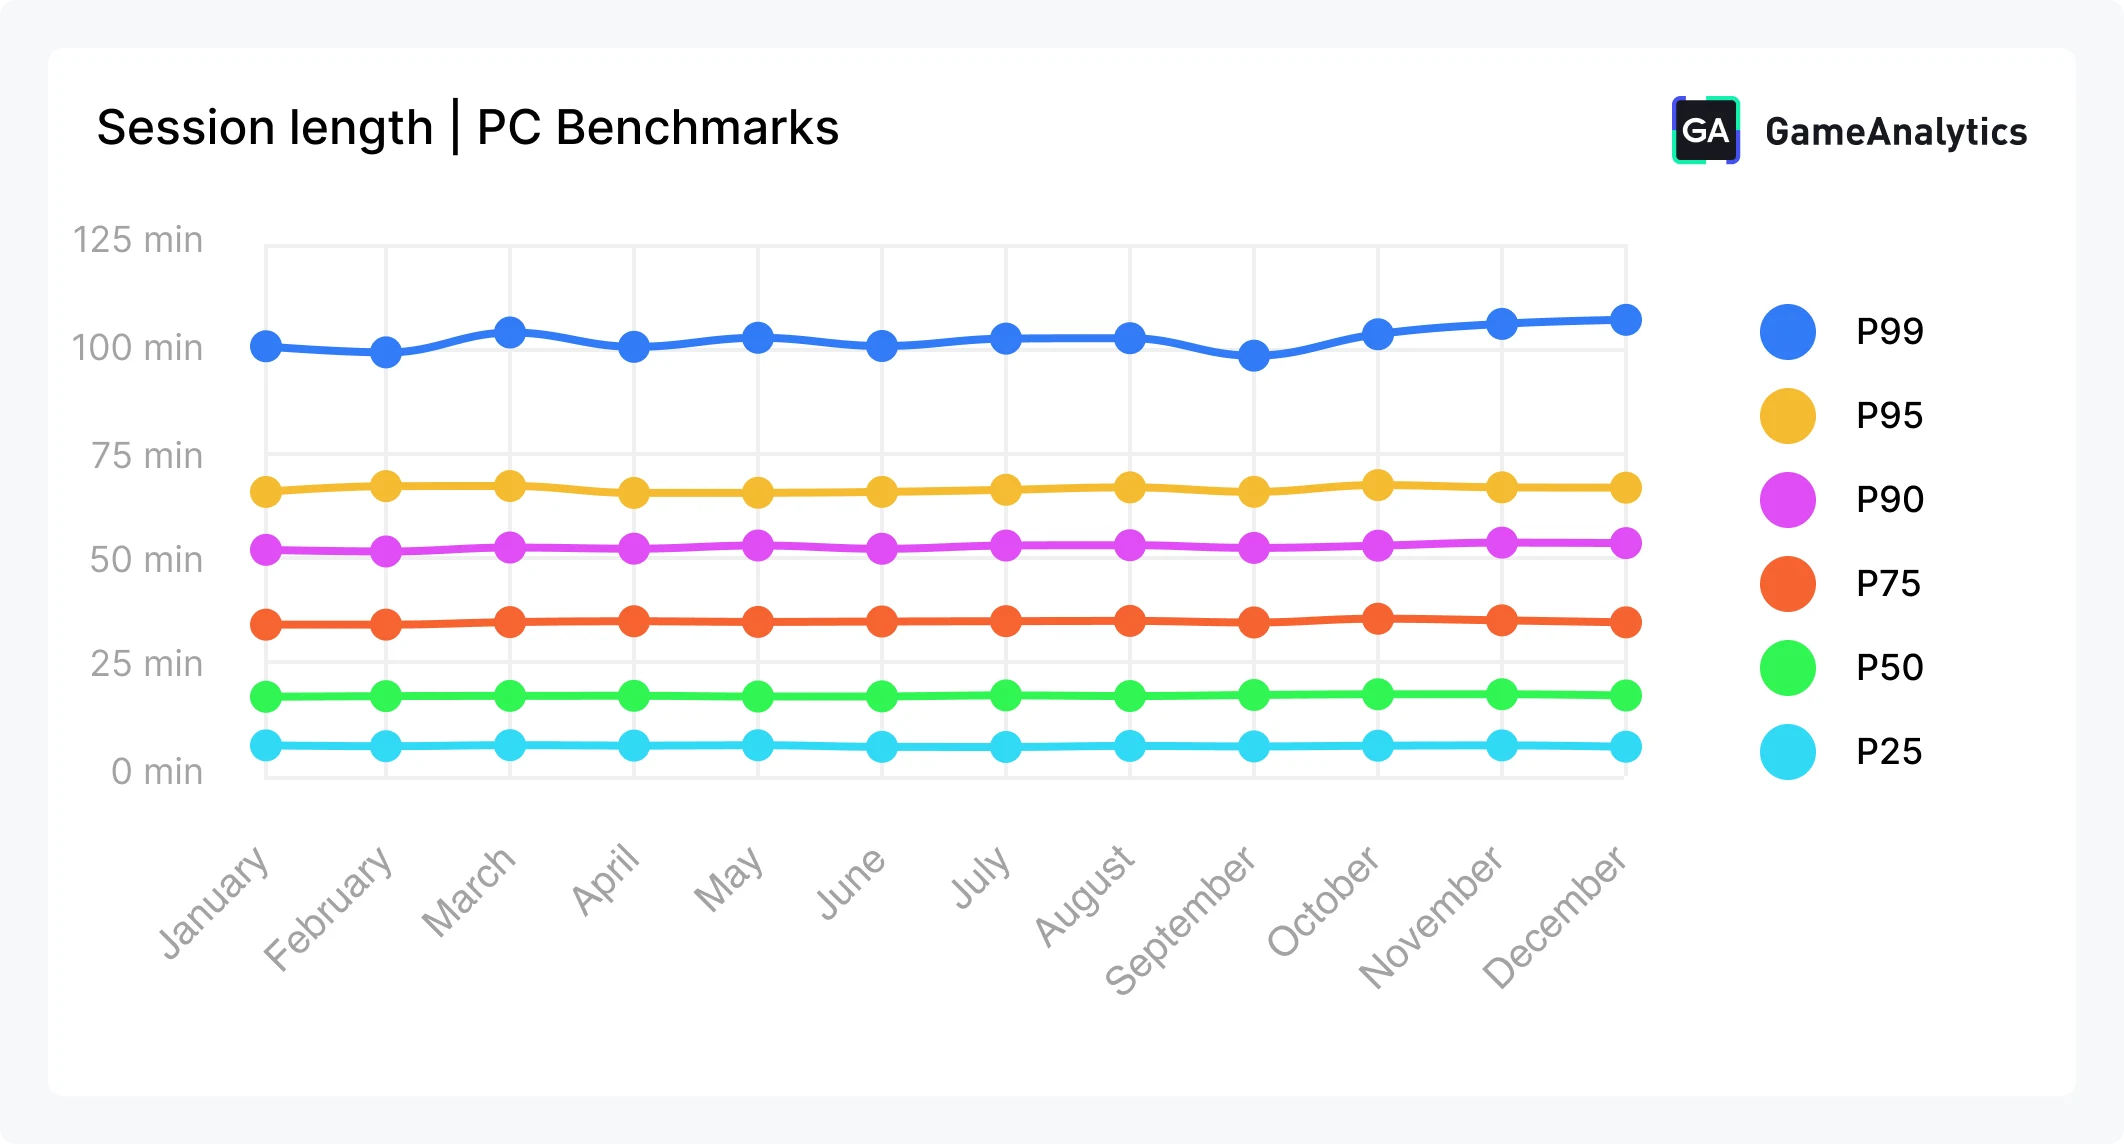
PC session length captures how long players stay engaged once they start playing, making it a close companion metric to playtime. While playtime reflects total daily engagement, session length explains whether that time is concentrated into long, immersive sittings or spread across multiple sessions.
In 2025, median session length (P50) remained highly stable at around 18 minutes per session, while the top 25% of games (P75) consistently exceeded 30 minutes. Higher-performing titles showed a clear separation: the top 10% (P90) averaged just over 50 minutes per session, while the top 1% (P99) regularly exceeded 100 minutes, highlighting experiences designed for deep, uninterrupted play.
When viewed alongside playtime, longer session lengths often explain how games achieve high engagement without requiring frequent returns. In terms of retention, longer sessions can support stronger early engagement and content consumption, but do not automatically translate into higher day-based retention, particularly for narrative-driven or finite experiences.
Session count
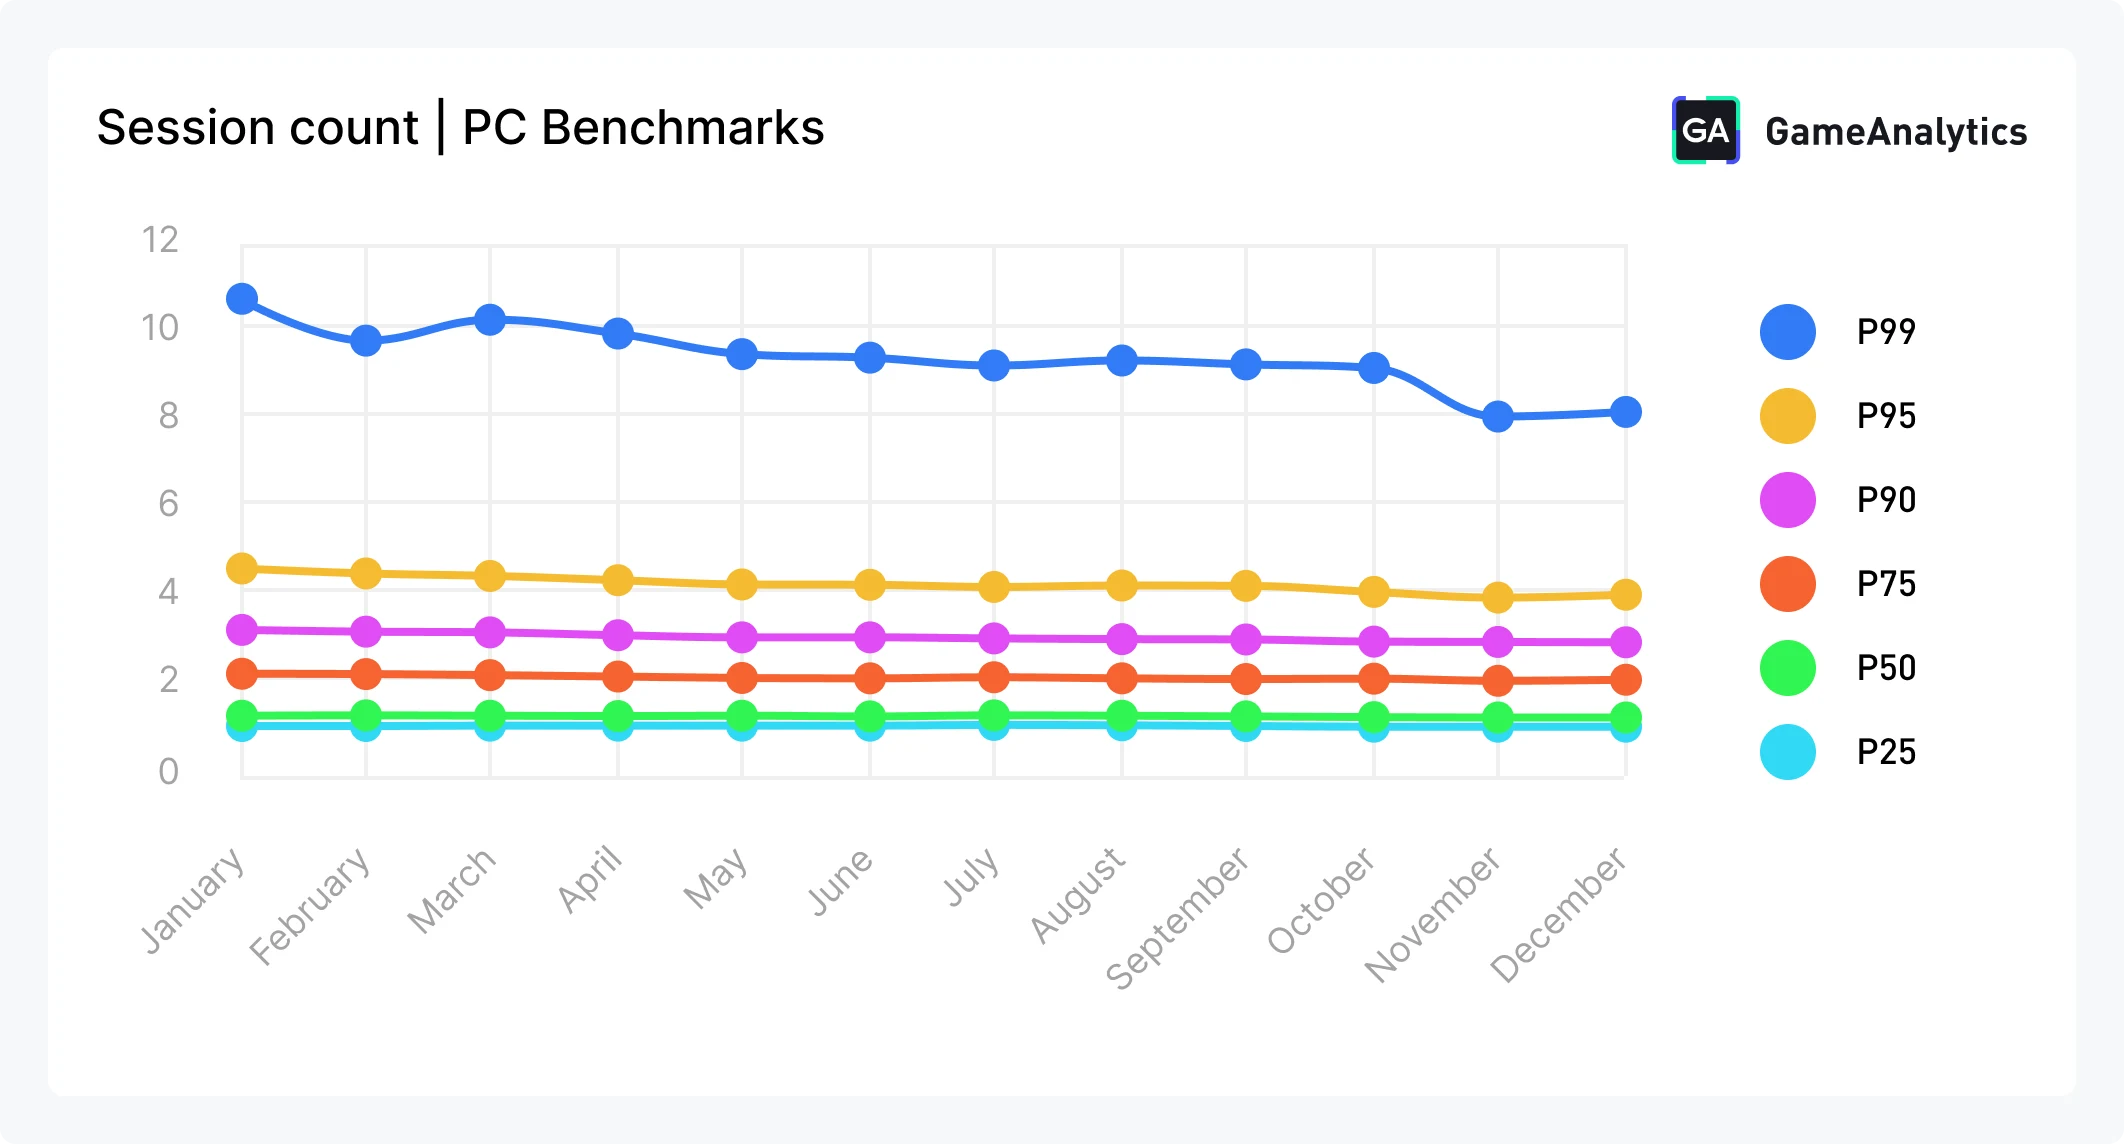
Session count measures how many times players start a game within a day, offering insight into engagement frequency rather than depth. On PC, this metric tends to be lower than on mobile, as players typically engage in fewer, longer sessions rather than frequent check-ins.
In 2025, the median PC game (P50) averaged 1.65-1.70 sessions per day, remaining stable throughout the year. The top 25% (P75) reached just over 2 sessions per day, while the top 10% (P90) hovered around 3 sessions. At the extreme end, the top 1% (P99) exceeded 7-10 daily sessions, reflecting games designed around highly repeatable loops, competitive play, or social coordination.
When viewed alongside session length and playtime, lower session counts paired with long sessions explain how many PC games achieve substantial playtime without frequent returns. In relation to retention, higher session counts often align with stronger early and mid-term retention, but are not a requirement for deep engagement, particularly in narrative or content-heavy experiences.
DAU vs MAU
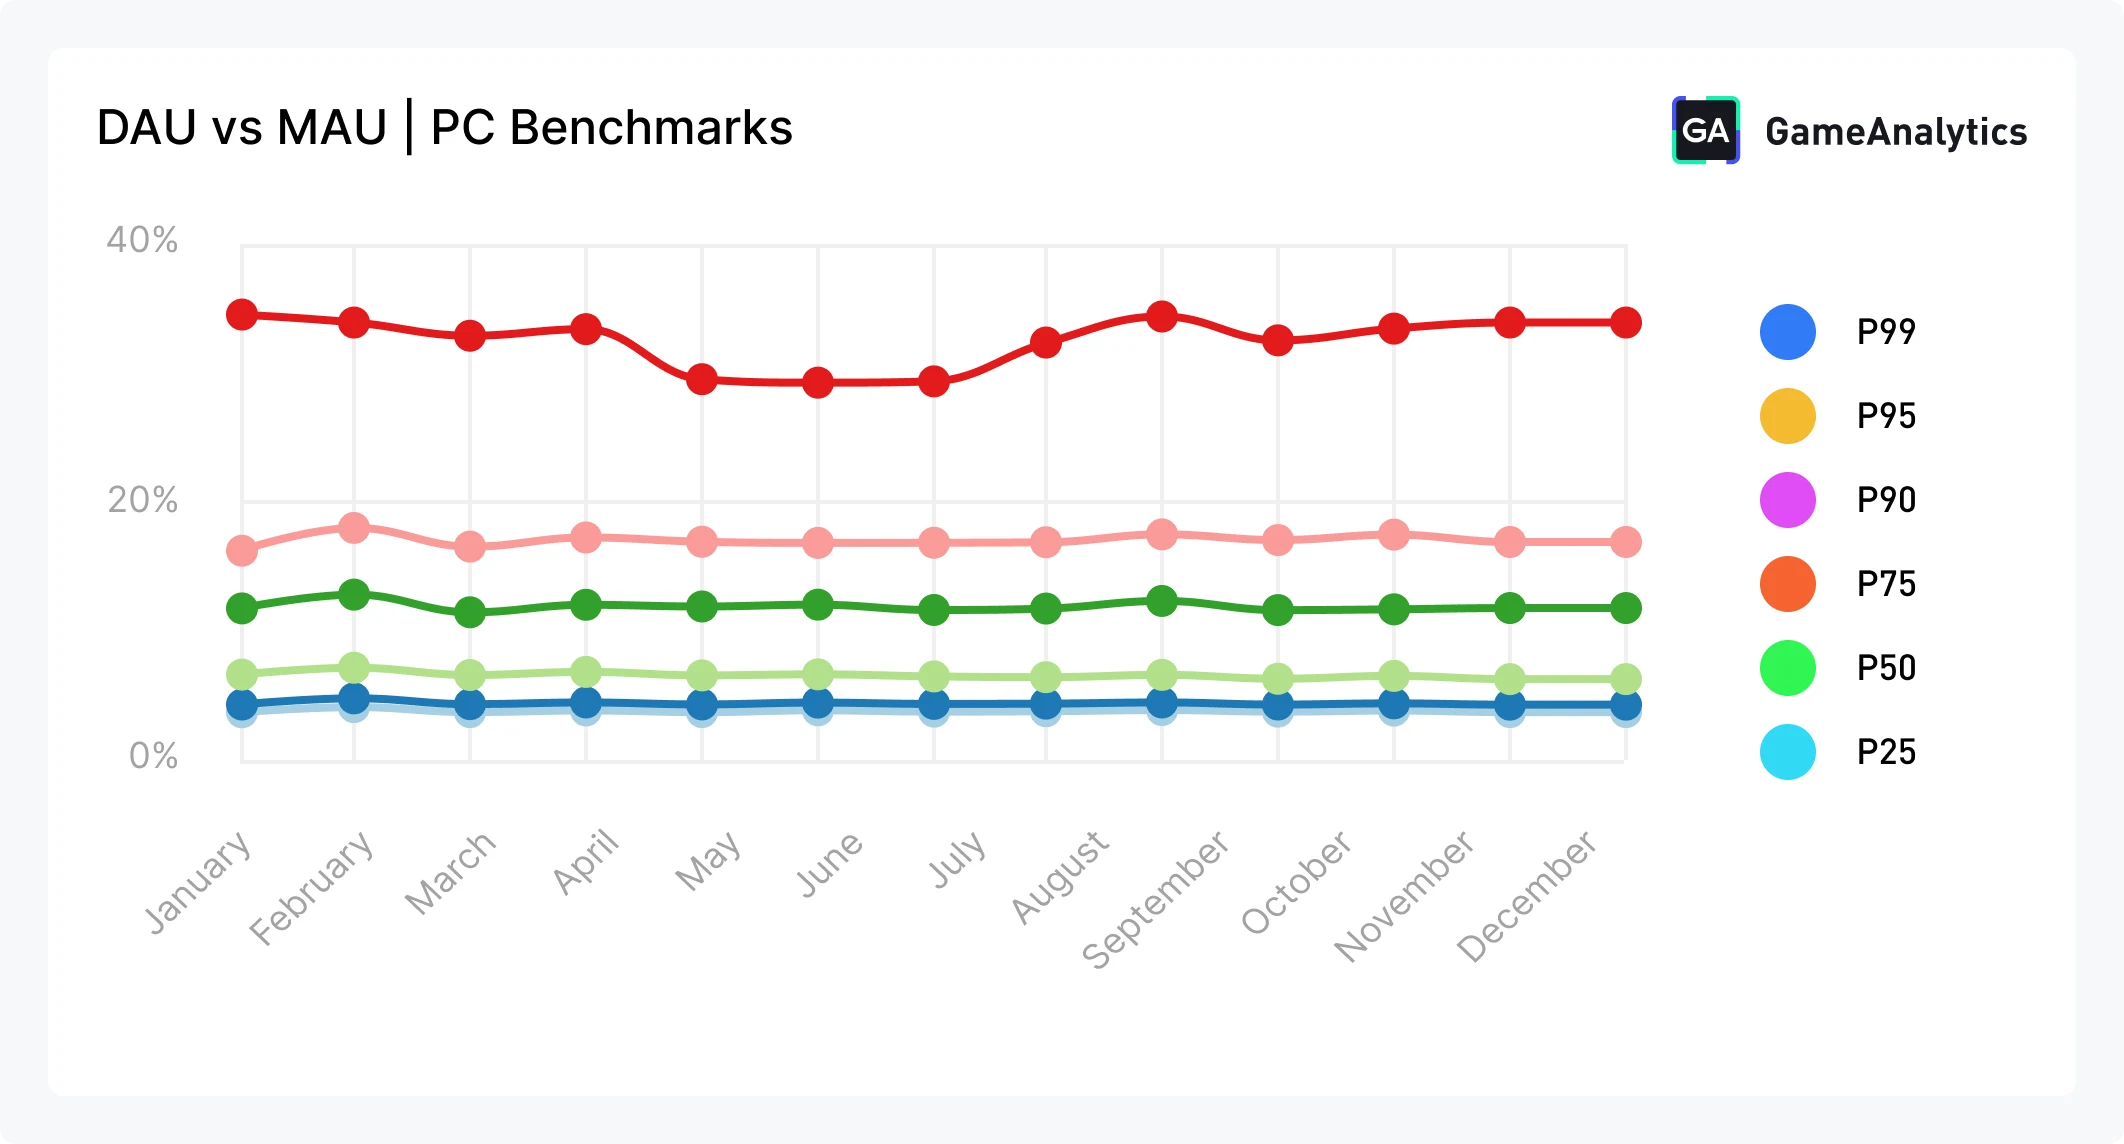
This ratio captures how often monthly players return on a daily basis, providing a view into cross-day engagement frequency rather than intra-day behavior. On PC, this metric reflects a game’s ability to establish recurring play patterns across days, not daily habit formation in the mobile sense.
Throughout 2025, the median game (P50) maintained a DAU-to-MAU ratio of roughly 4-5%, indicating that most PC players engage on only a few days per month. The top 25% (P75) reached around 7%, while the top 10% (P90) consistently exceeded 13-15%, signaling more regular return behavior. At the high end, the top 1% (P99) reached extreme values, often above 50%, as seen in live-service, multiplayer, or community-driven titles.
When compared to session count, the distinction becomes clear: DAU vs. MAU explains how many days players return, while session count explains how often they play on those days. Games with lower DAU vs MAU but long sessions and high playtime often reflect binge-style or finite experiences, whereas games with higher DAU vs MAU and moderate session lengths tend to align with stronger D7 and D30 retention.
Interpreting session count and DAU vs MAU together
Taken together, session count and DAU vs. MAU describe engagement rhythm. They help distinguish between games that rely on deep, infrequent play and those that succeed through repeated, structured returns. When combined with retention, playtime, and session length, these metrics provide a complete picture of how, how often, and for how long PC players engage, without forcing mobile-centric interpretations onto PC behavior.
New users
New users capture the inflow of first-time players and reflect a game’s ability to attract attention through launches, updates, promotions, or platform visibility. On PC, this metric is inherently event-driven and should be interpreted as a signal of momentum rather than sustained growth on its own.
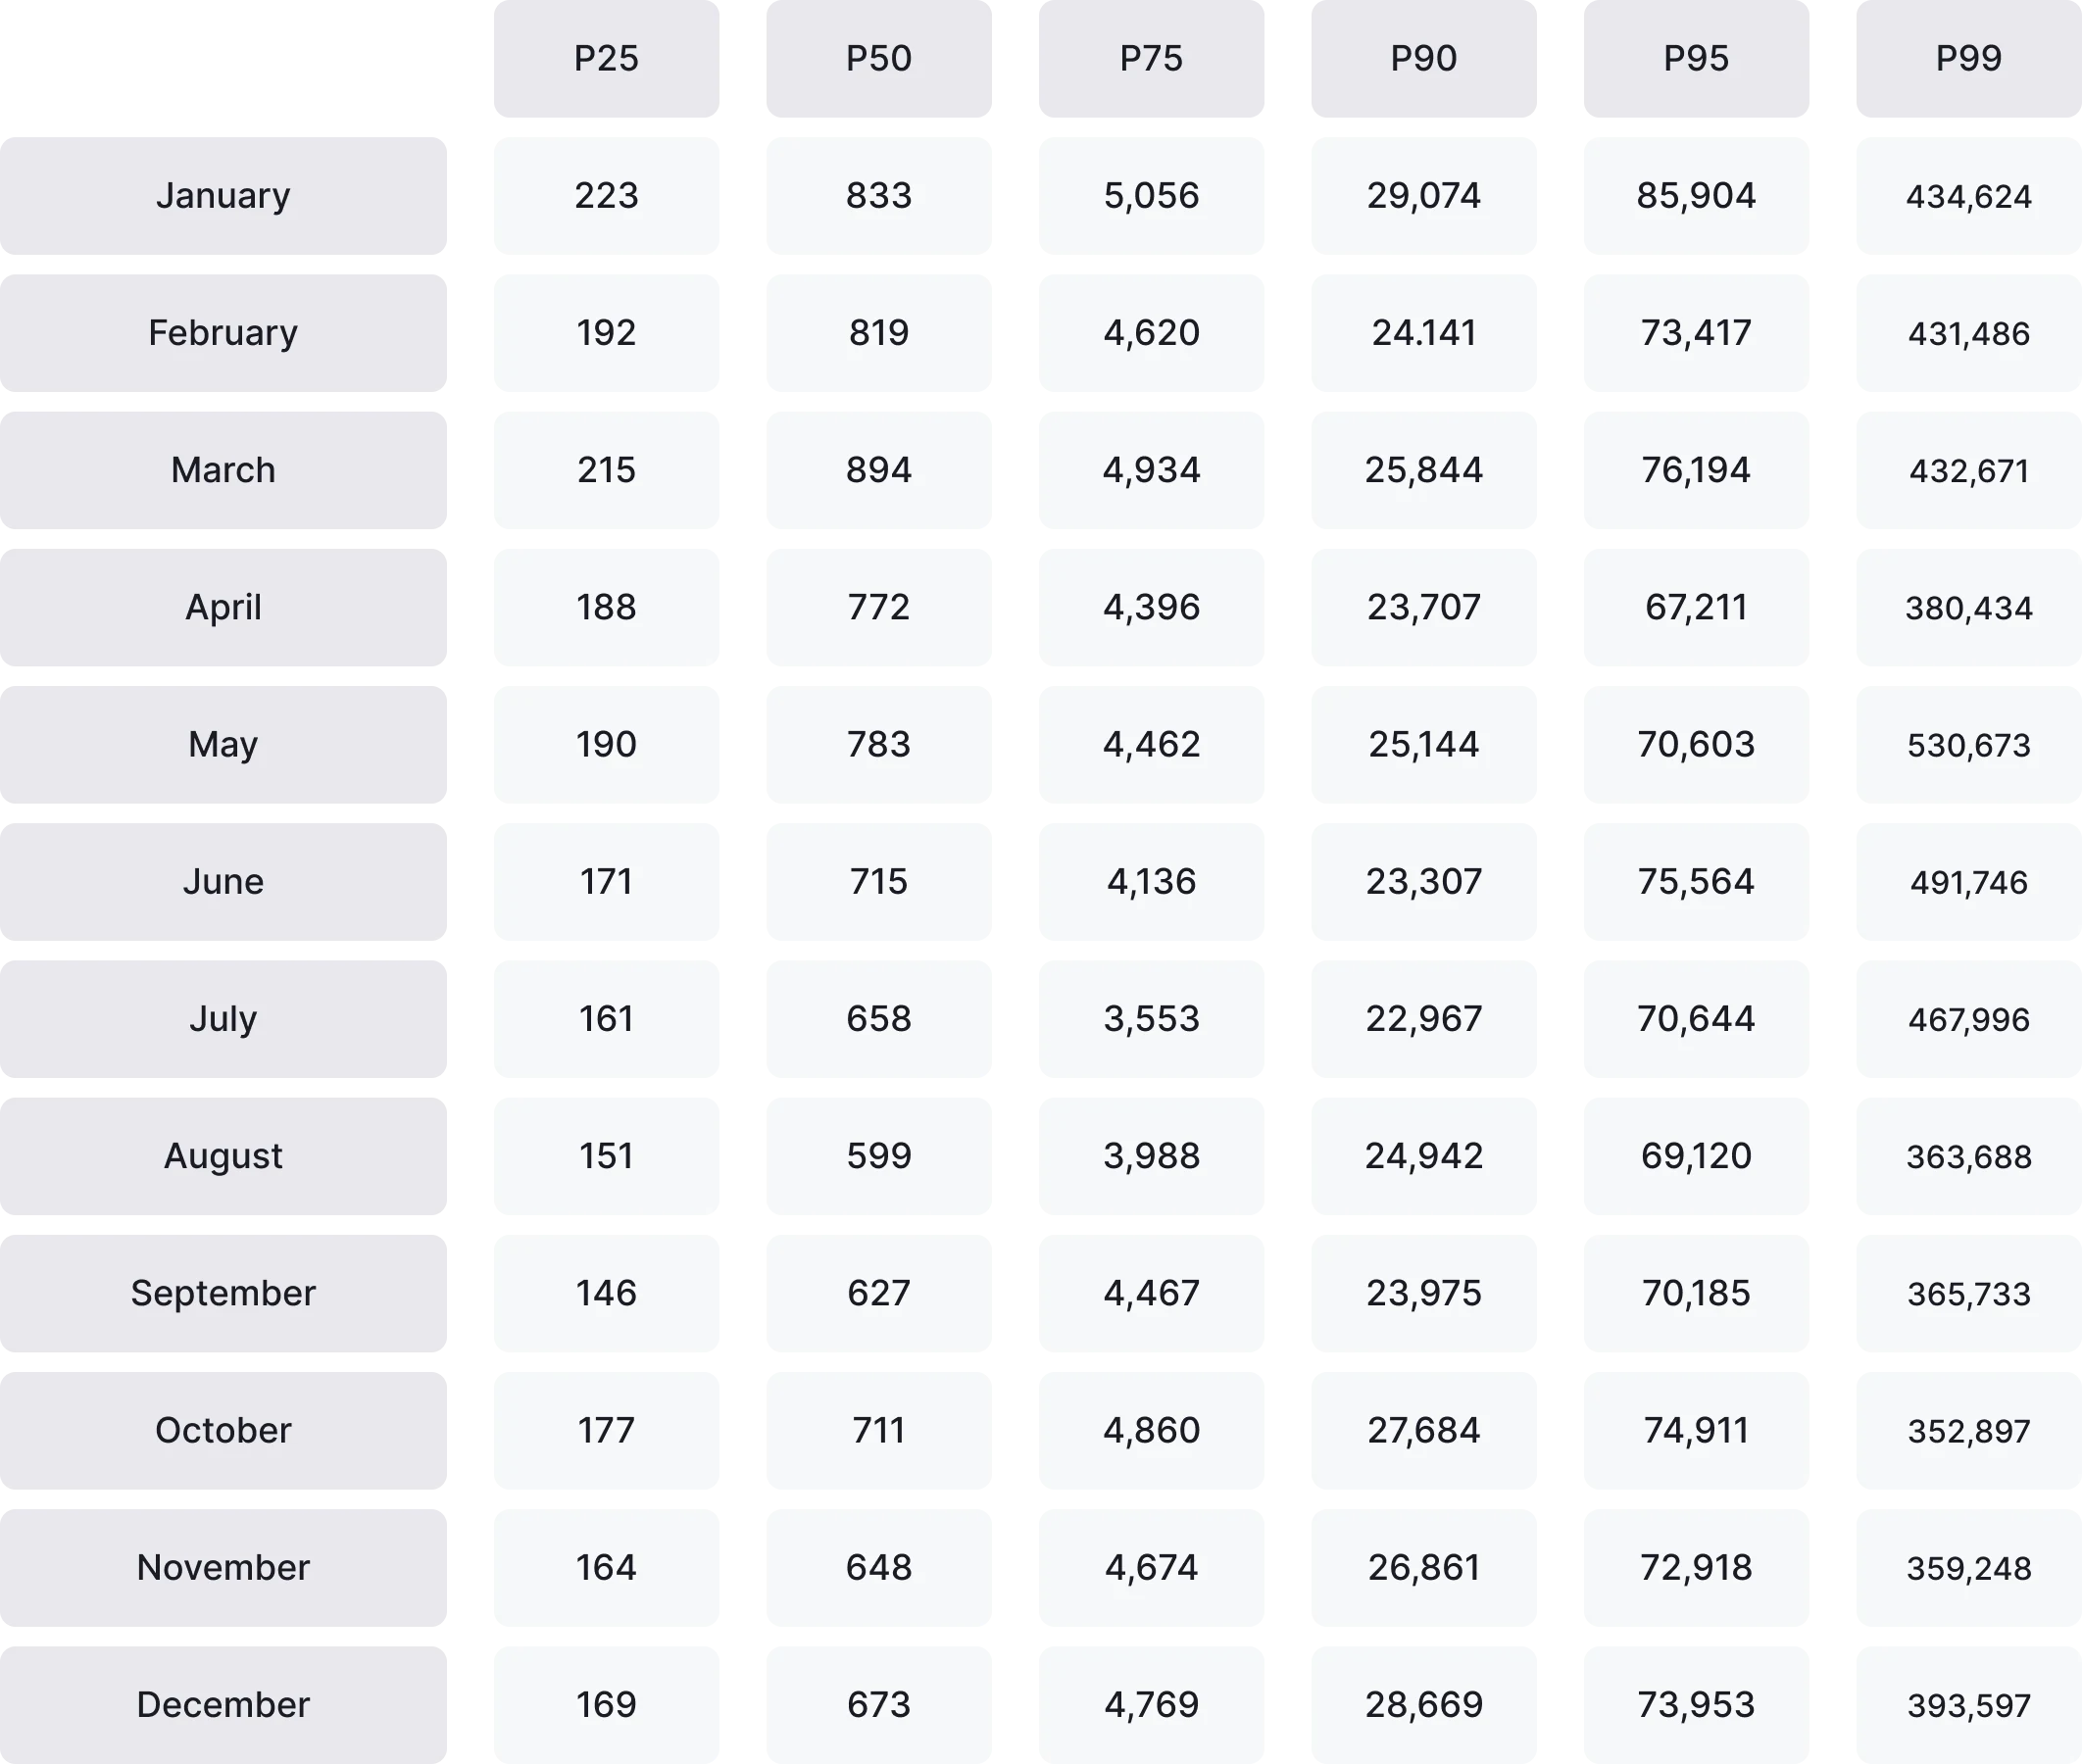
In 2025, the median PC game (P50) attracted between 600 and 900 new users per month, while the top 25% (P75) consistently onboarded 3,500-5,000 players. The gap widens sharply at the top: the top 10% (P90) regularly exceeded 20,000 monthly new users, and the top 1% (P99) reached hundreds of thousands, levels typically associated with major releases, high-visibility updates, or strong creator-driven exposure.
When viewed alongside retention and engagement, clear patterns emerge. Games with high new-user inflow but low D7 and D30 retention often reflect short-lived interest tied to launches or promotions. In contrast, titles that pair steady new-user acquisition with longer session lengths, higher playtime, and stronger DAU-to-MAU ratios tend to convert attention into lasting engagement. Notably, many of the games with extreme new-user spikes also show high playtime but only moderate retention, suggesting concentrated play during initial discovery rather than ongoing return behavior.
Overall, new users provide essential context for interpreting PC benchmarks. They help explain sudden changes in playtime, session count, or DAU vs. MAU, and highlight whether engagement metrics are driven by sustained interest or temporary surges. When analyzed together, these metrics offer a clearer picture of how PC games attract players, and how effectively they turn that attention into durable engagement.