Stay up to date with GameAnalytics updates
A rundown of the latest GameAnalytics feature releases, product enhancements, design updates, and important bug fixes.
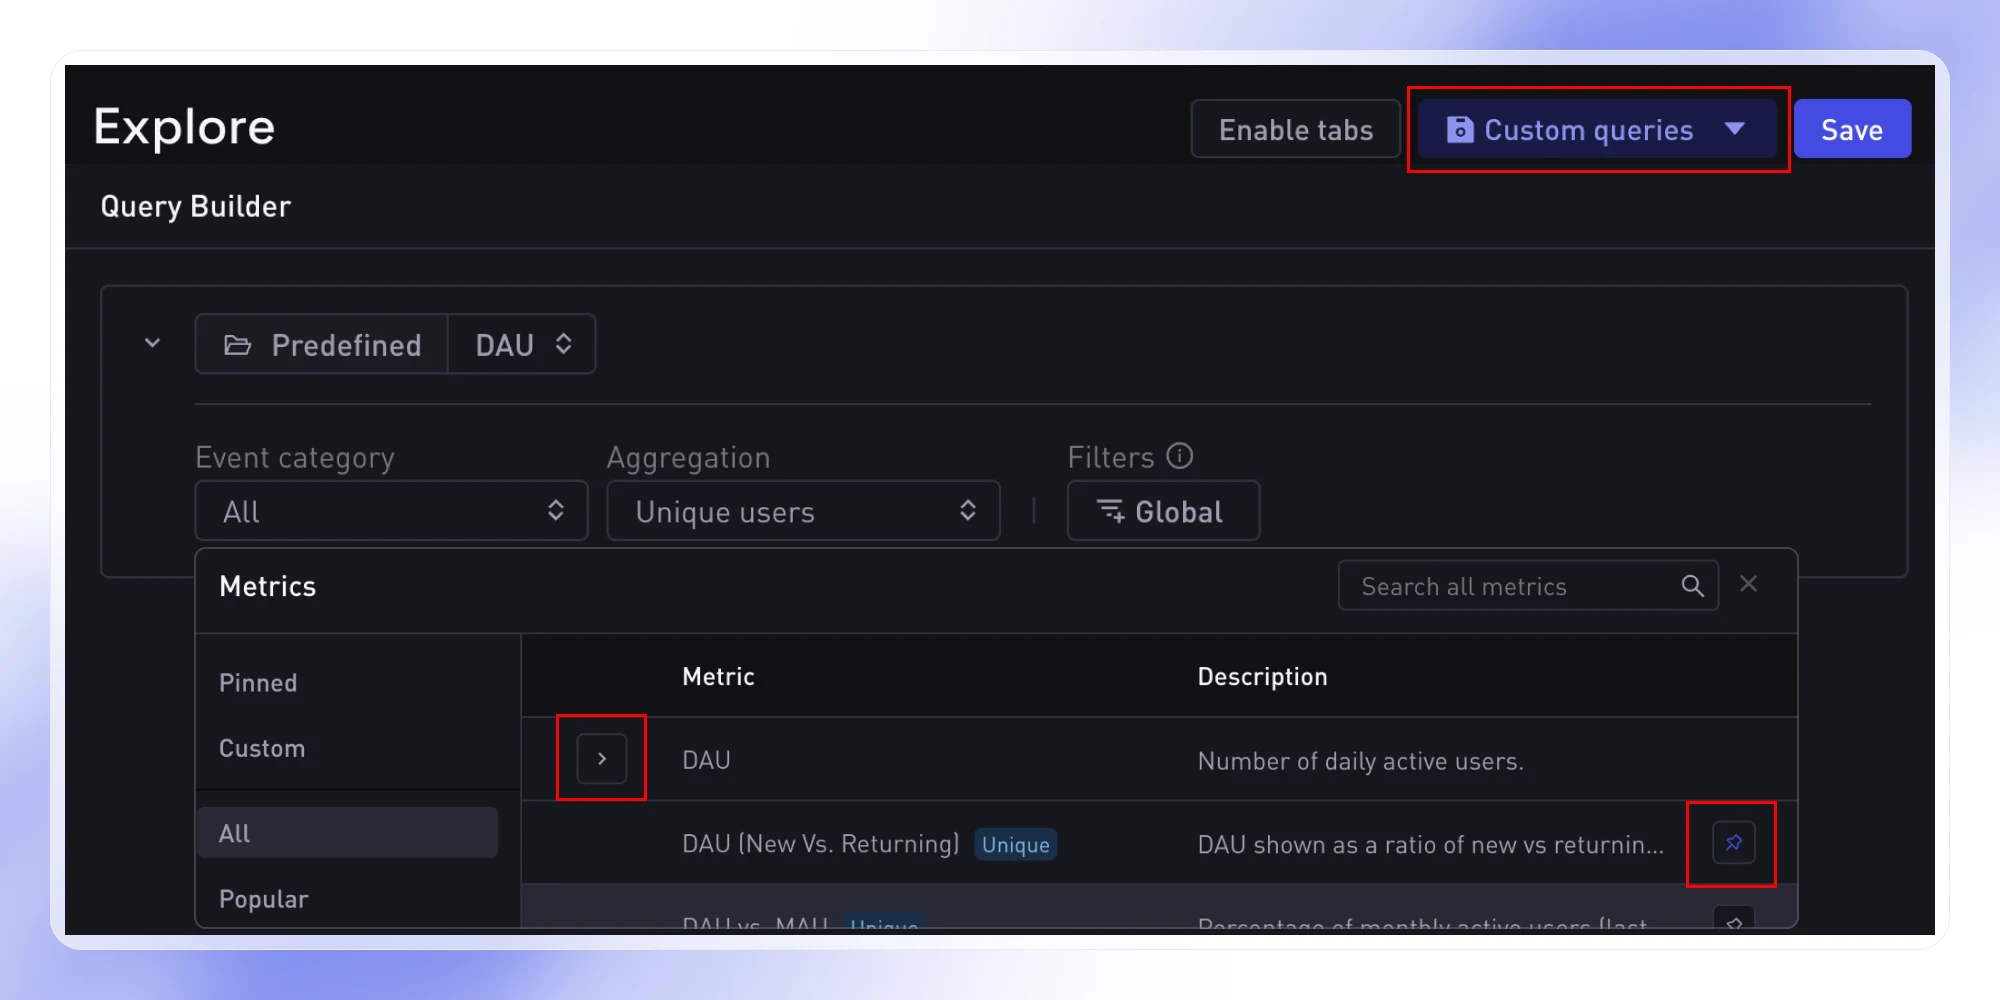
Query Builder Update
We’ve improved the Query Builder to make finding and using metrics faster. Metrics are better organized, can be favorited for quick access, and your saved Views have moved to Custom Queries - which can also be used in Dashboards.
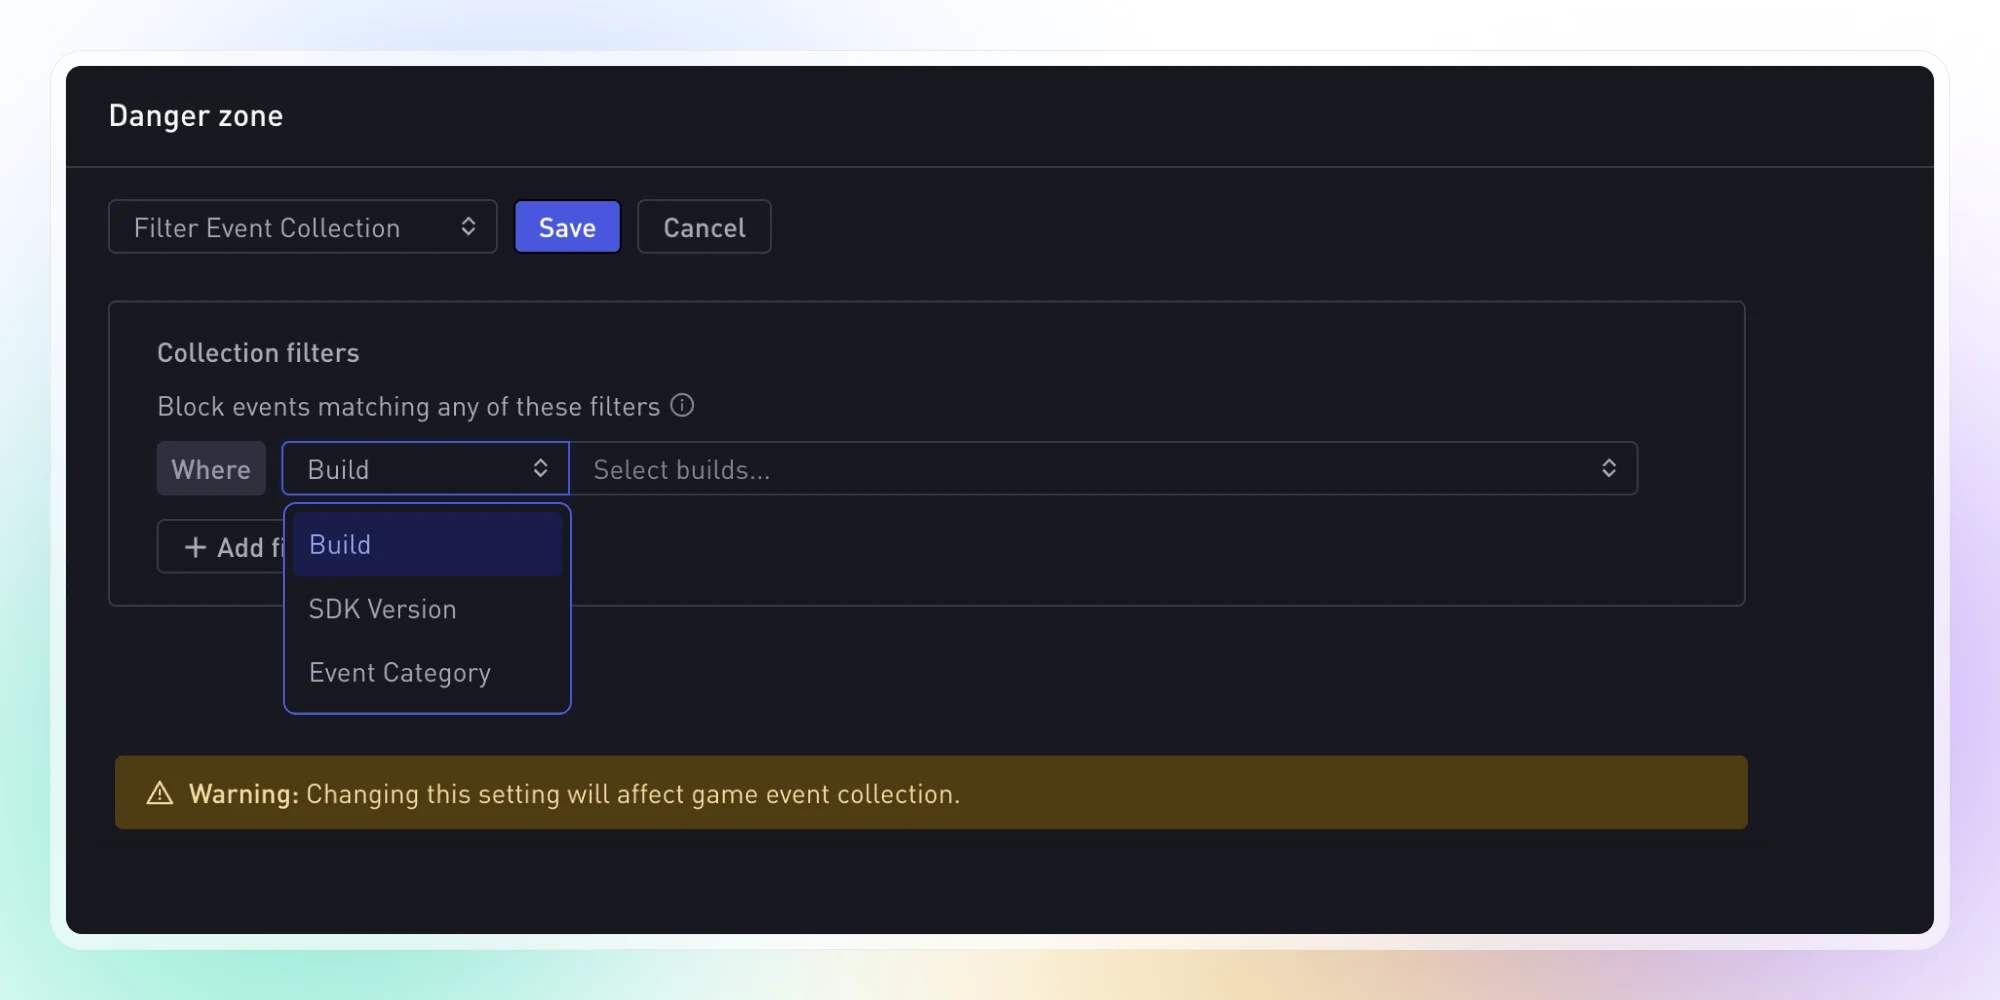
Granular Data Blocking
Take control of your data quality at the source. You can now block specific events from being collected - filtering by build, SDK version, event category, or event details. Stop buggy builds or outdated SDKs from polluting your data, reduce noise from unwanted events, and protect your cardinality limits before issues escalate.
Cleaner data in. Better insights out.
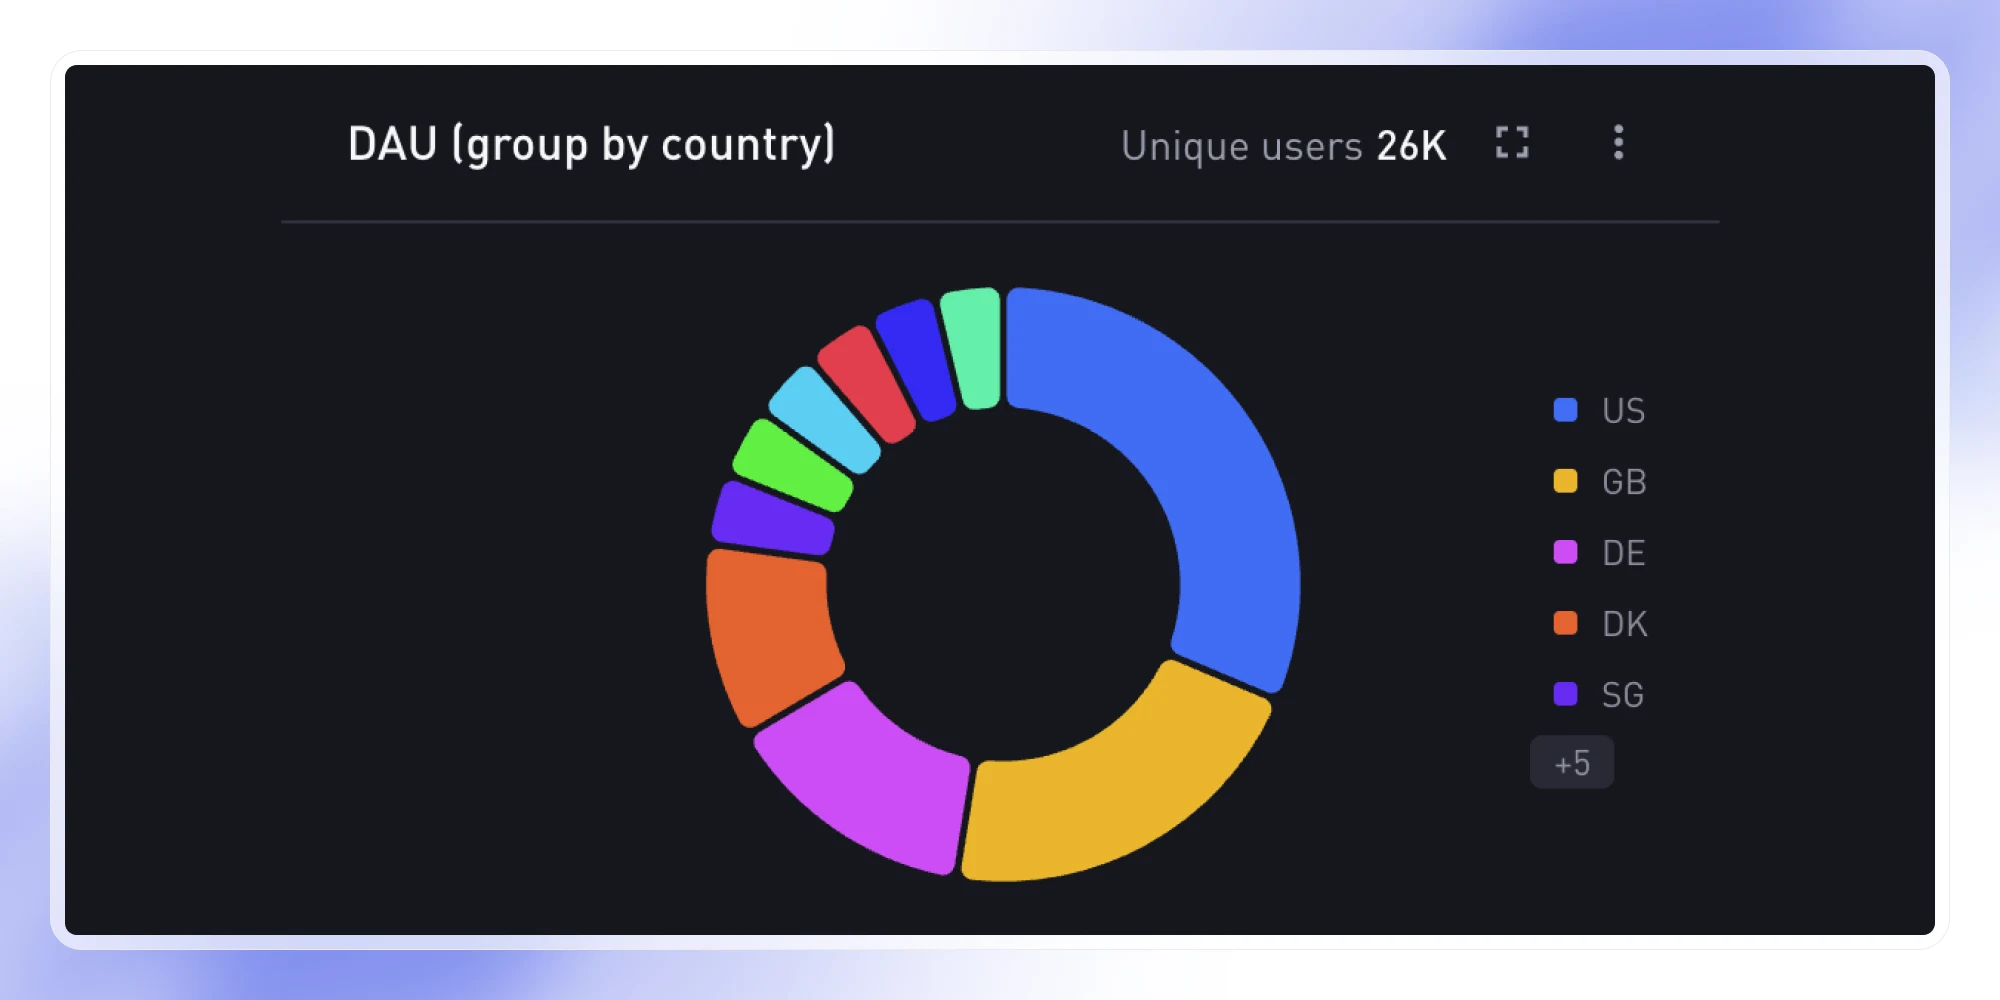
Pie Chart Visualization
See your data from a new angle! Pie charts are now available for Dashboards, letting you visualize proportions at a glance.
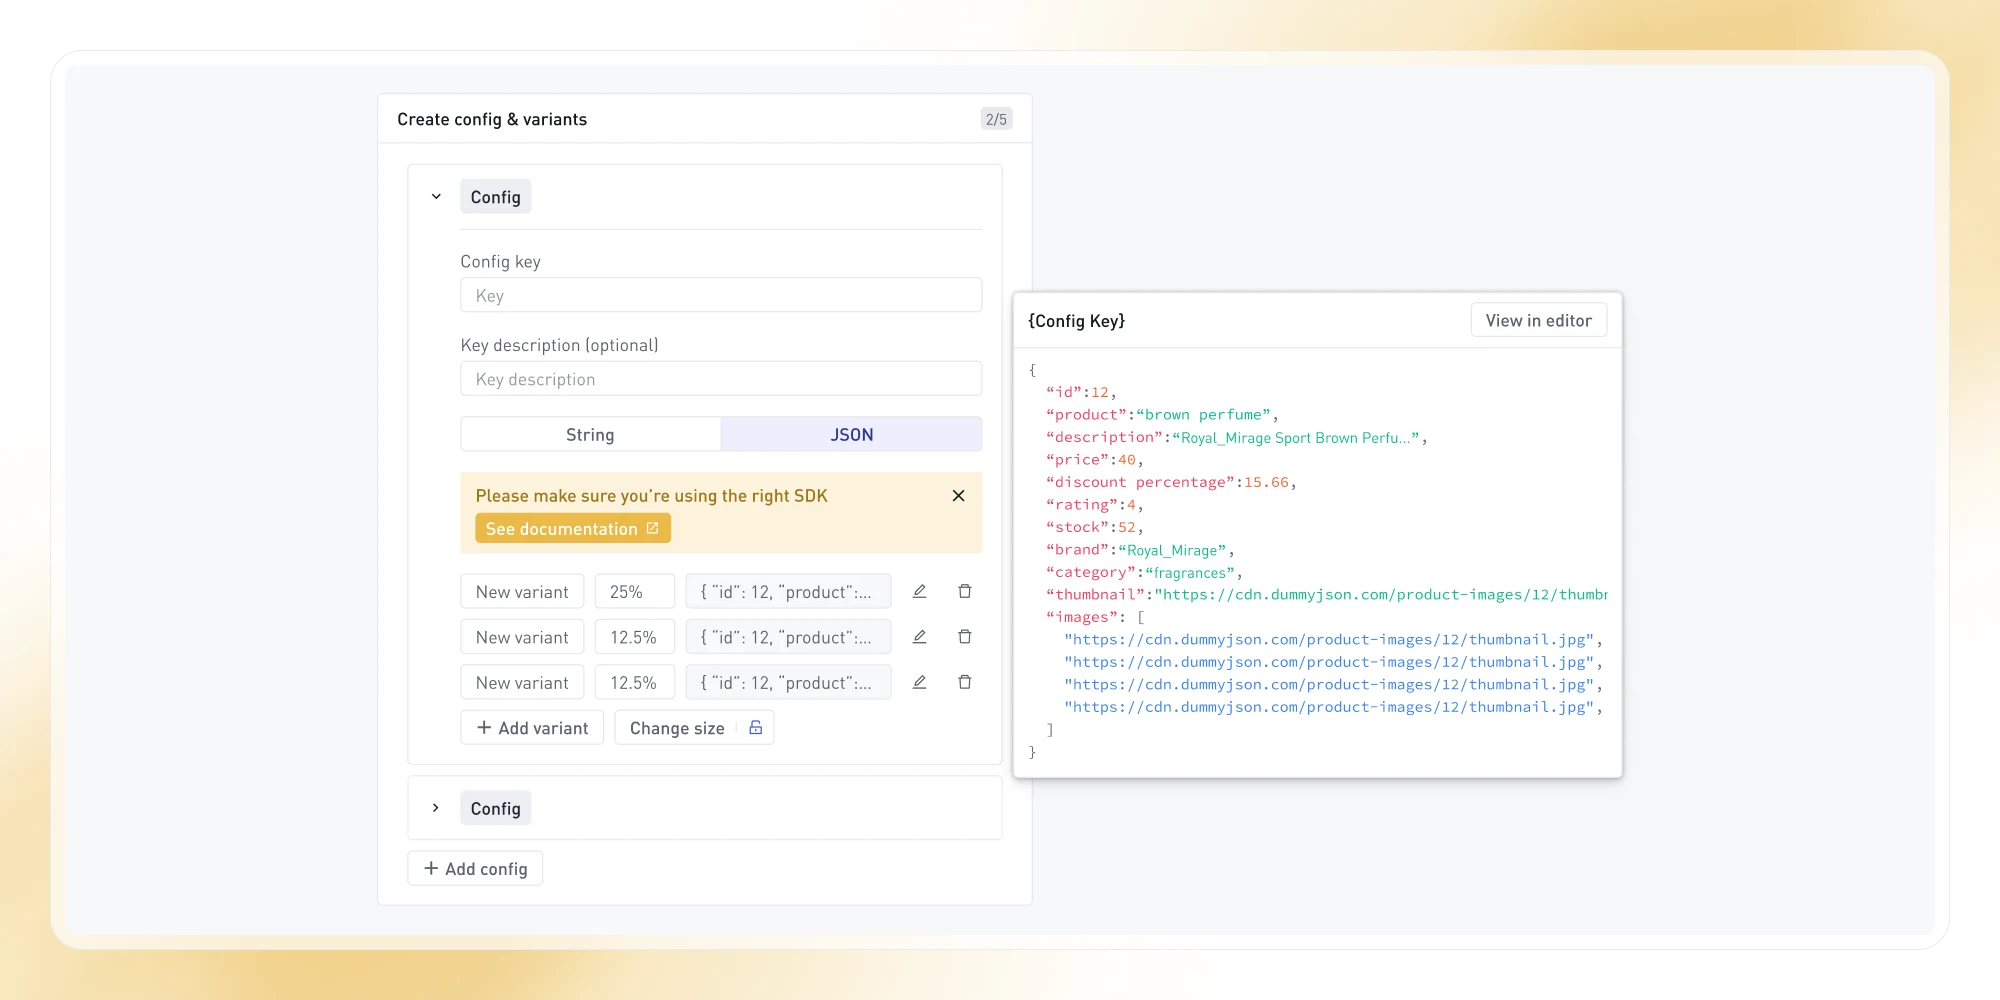
A/B Testing: Unlimited Users & JSON Support
You can now skip the player limit and set tests to enroll unlimited users. Plus JSON values are now available, so you can expand beyond strings and experiment with more complex configs.
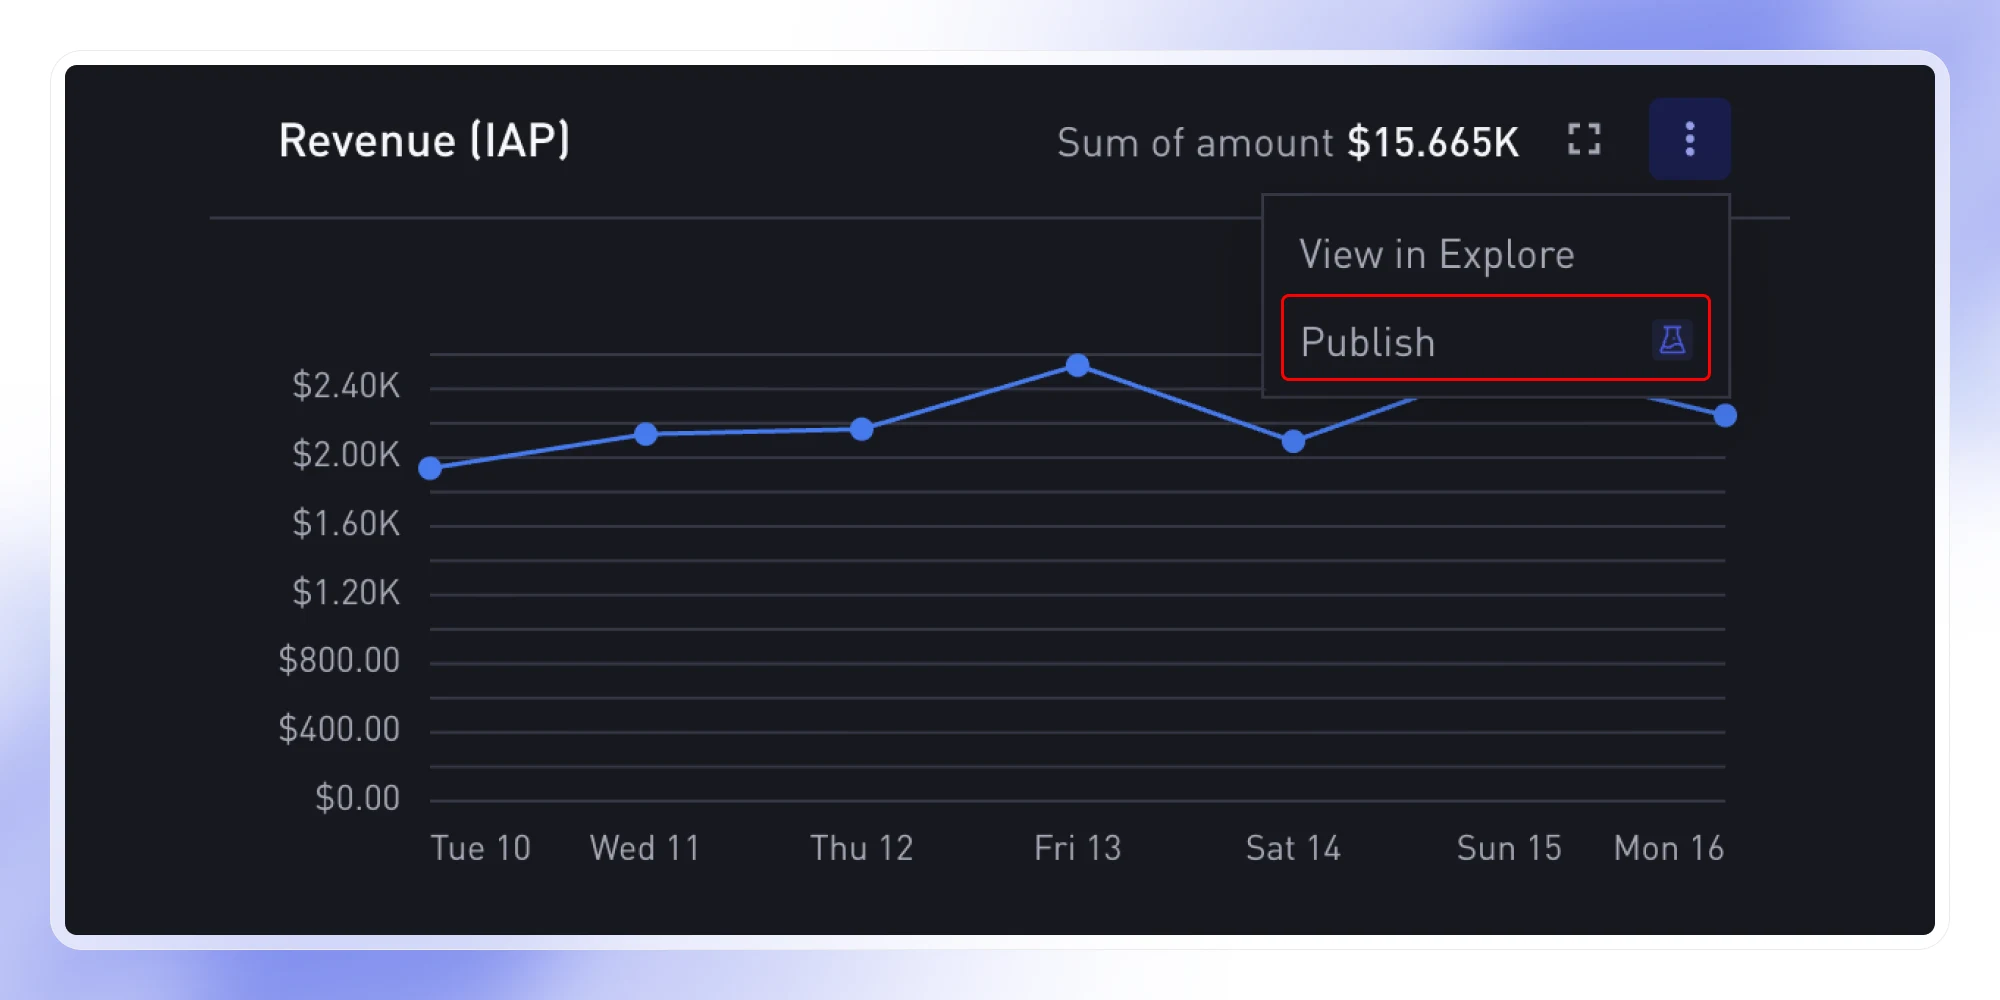
Publish Widgets and Dashboards
Show off your insights! Any widget or dashboard can now be shared as a public embed - ready for websites, socials, or internal dashboards.
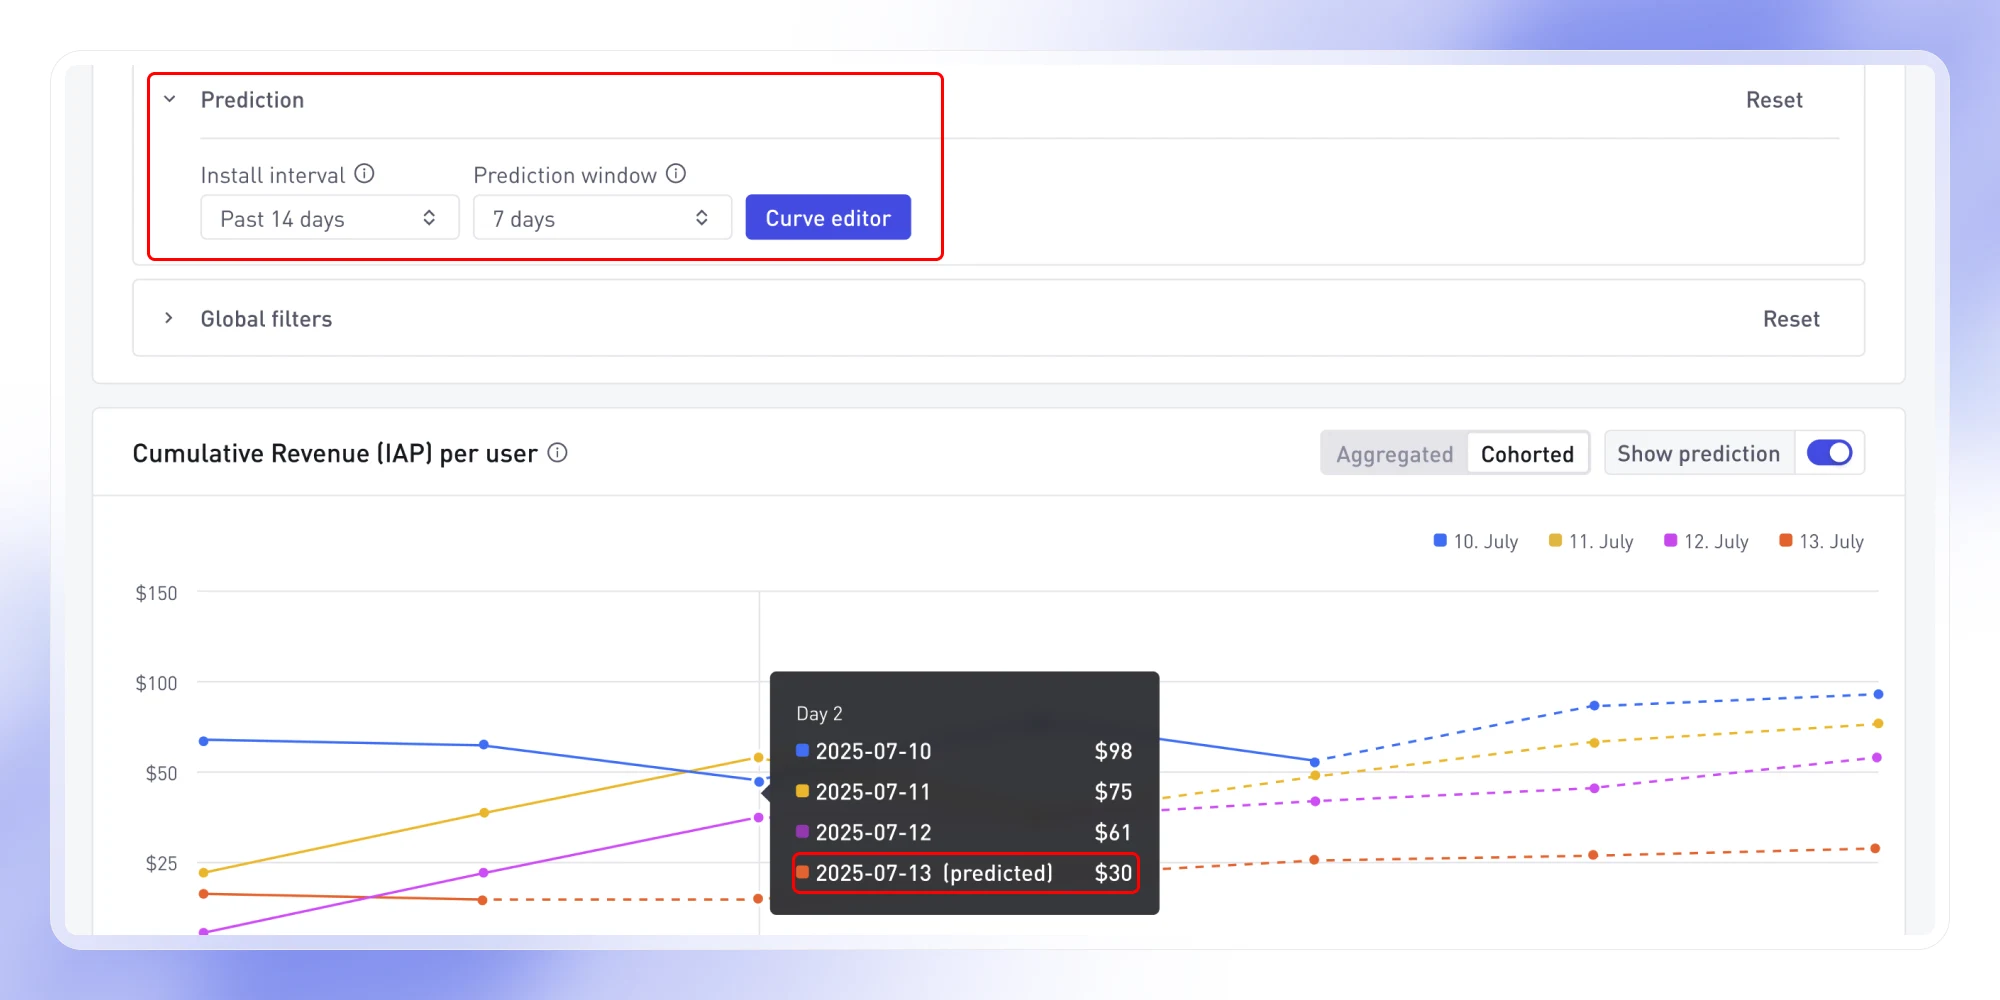
Cohorted pLTV
See where your IAP revenue is headed with new cohorted pLTV reporting. Forecast lifetime value using customizable prediction curves and view both historical and projected revenue by install day. Plan faster, optimize spend, and make smarter monetization decisions with forward-looking cohort insights.
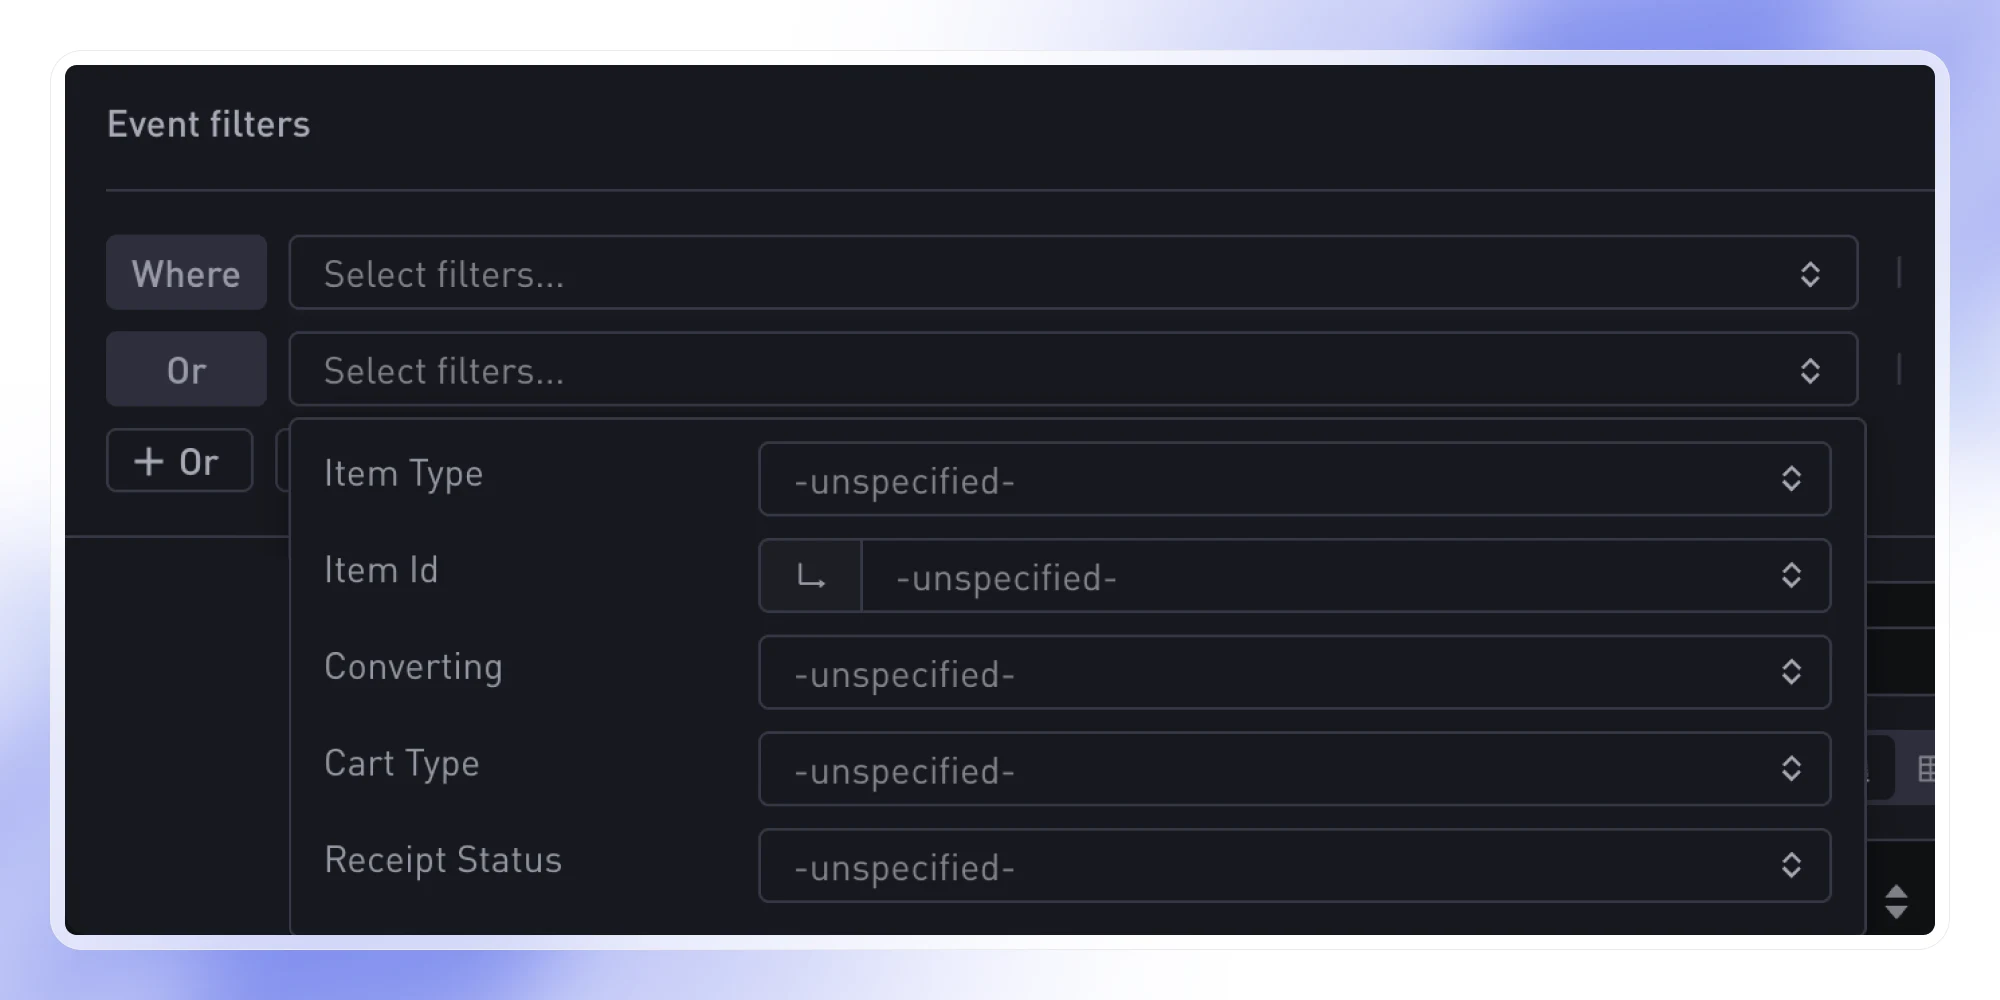
Cohorts: Event Filters
Get even granular with your Cohorts analysis. Filter to focus on revenue from specific ad formats, track critical errors, or zoom in on any event that matters, giving you sharper - more targeted insights.
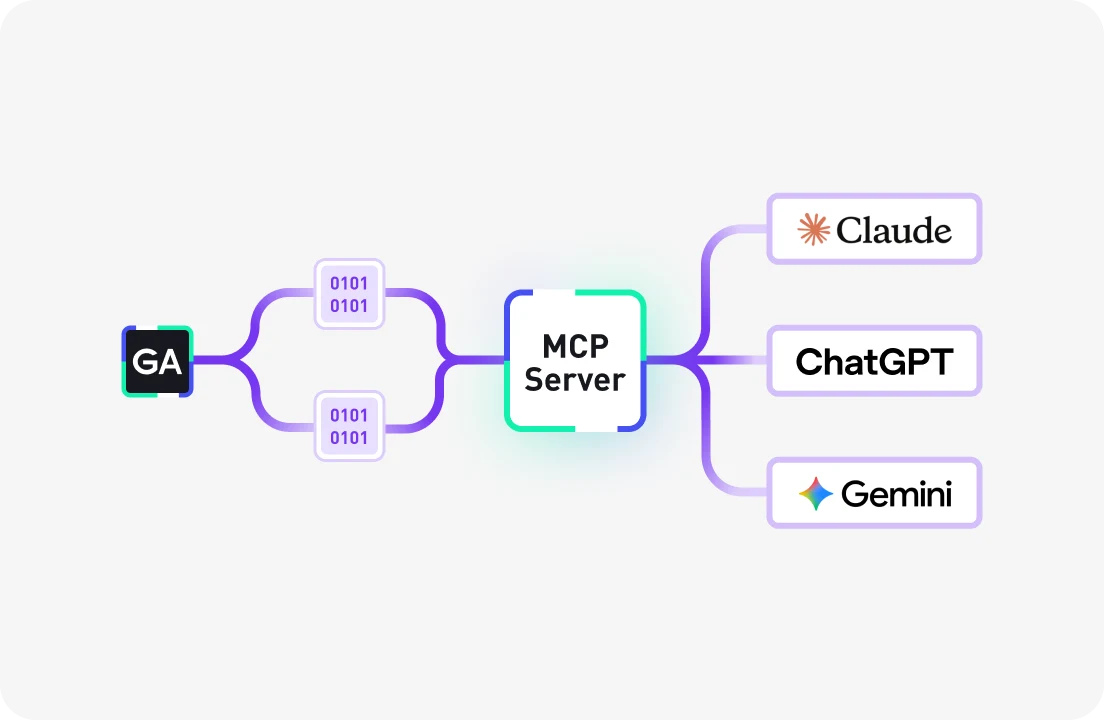
MCP Server (Conversational Analytics)
Chat directly with your GameAnalytics data using AI. The open-source GA MCP Server connects your metrics to AI assistants like ChatGPT, Gemini Claude and more, letting you ask plain-language questions and get instant, data-driven answers. Explore KPIs, trends, and anomalies without dashboards or SQL - bringing insights straight into the tools you already work in.
Available with PipelineIQ Pro subscriptions.