This report provides an in-depth analysis of key gaming metrics across different regions, genres, and platforms, offering valuable insights into player behavior and market trends.
TL;DR
- Retention declined year-over-year across the board. D1 fell from ~28-29% in 2023 to 26.48-27.69% for the top 25%, with the bottom 25% at just 10-11.5%. Median D7 slipped from ~4-5% to 3.42-3.94%, and 75% of games failed to clear 3% D28 - pointing at content pacing and progression as the recurring weak spot.
- iOS and Android split by metric. iOS leads on D1 retention (31-33% vs 25-27% among top-quartile games), while Android leads on session count, likely reflecting its heavier casual and hyper-casual mix.
- Engagement sits at ~22 min playtime, 5-6 min sessions, 4 sessions/day at the median - but the top 2% of games exceed four hours of daily playtime, with Roblox mobile a major contributor to that tail.
- Regions trade off frequency against depth. The Middle East leads median retention on every horizon (D1 22.64%, D7 4.91%, D28 1.49%); Africa tops playtime (26.85 min) and session count (5.45/day) despite weak retention and ~5 min sessions; Oceania and North America favor fewer but longer sessions (6.85 min in Oceania, 3.75 sessions/day).
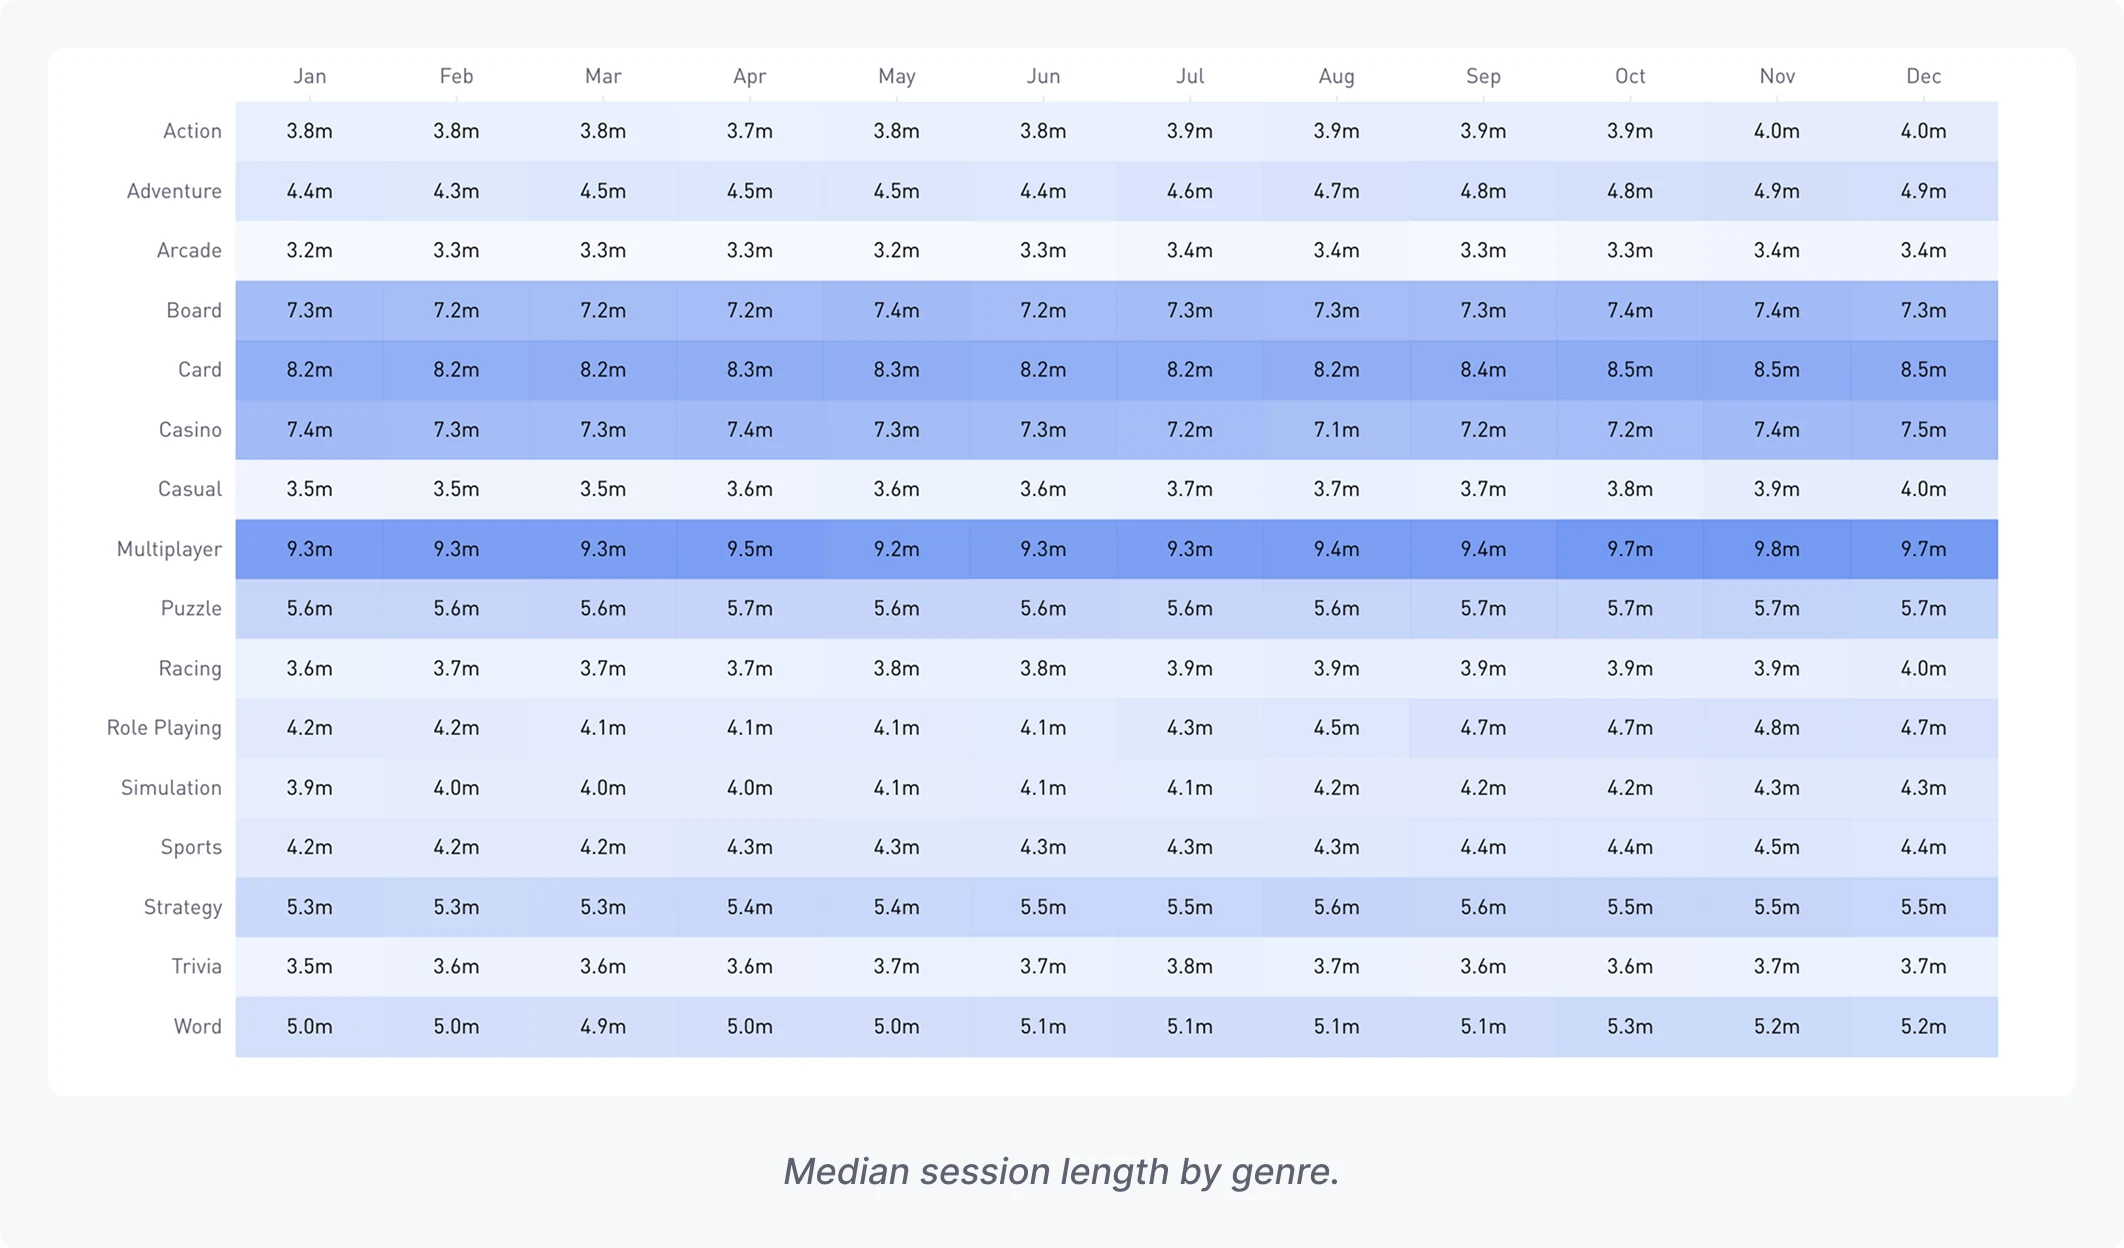
- Genre shapes the engagement profile. Board, Card, Puzzle and Casino games hold up best across D1, D7 and D28 while also ranking high on playtime and session count; Arcade hooks players early but loses them; Multiplayer delivers the longest sessions but the weakest retention overall.
Introduction
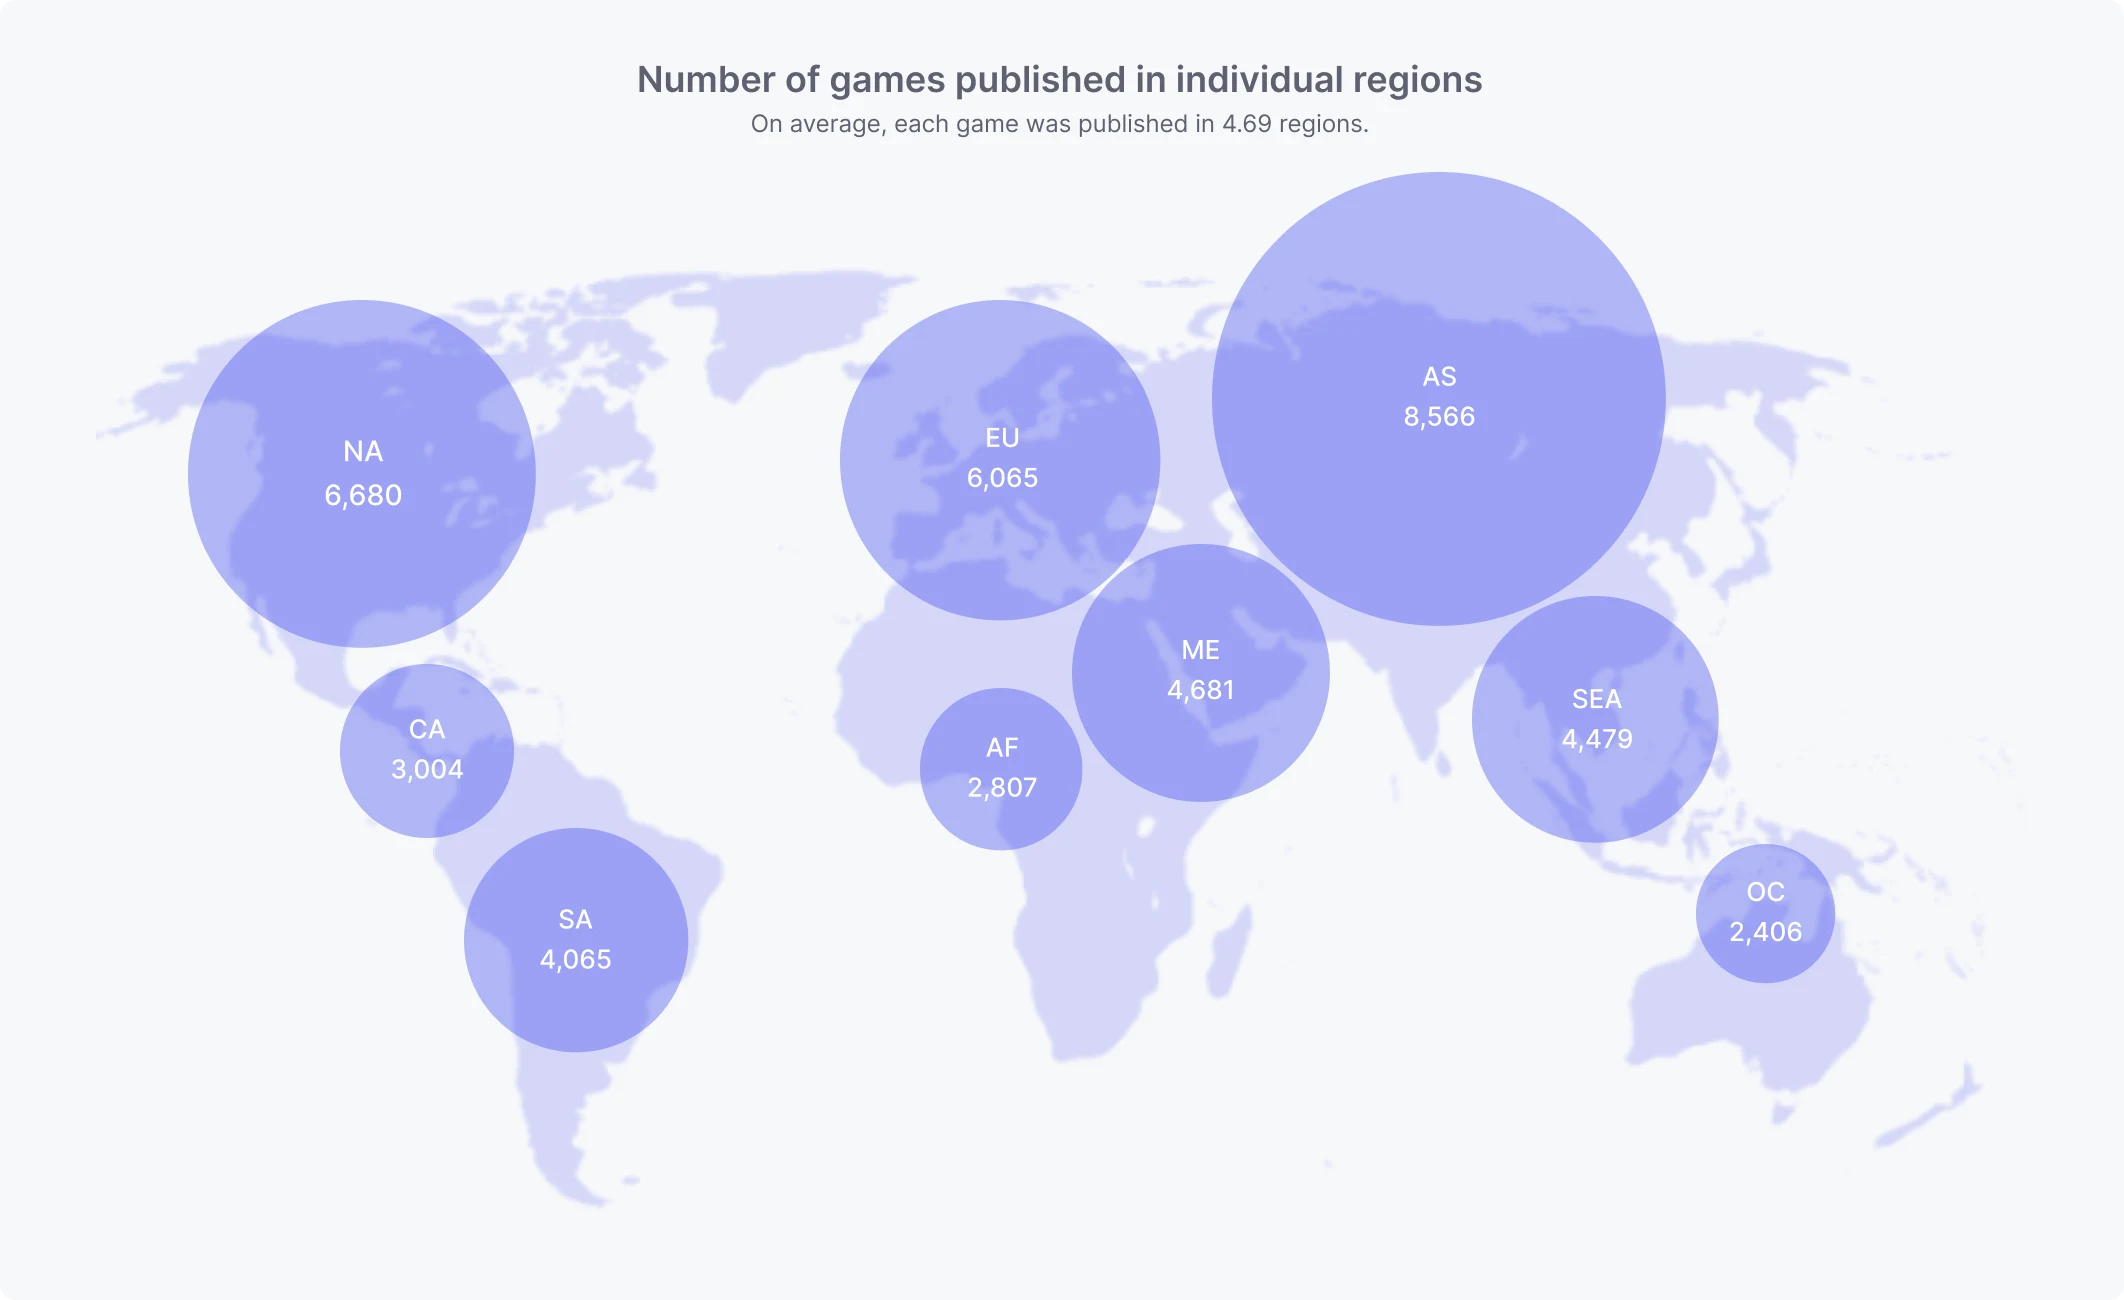
GameAnalytics is uniquely positioned to provide mobile gaming benchmarks due to the scale, diversity, and quality of the data we analyze. With tens of thousands of games leveraging our platform to optimize their strategies and refine game mechanics, our vast and comprehensive dataset represents a broad cross-section of the mobile gaming industry. Each game in our dataset spans four to five regions on average, offering a global perspective on player behavior and game performance.
The depth and breadth of data means we can identify trends and patterns that go beyond isolated markets or genres, making these insights both globally relevant and locally actionable. Our analytics platform captures key game metrics - like DAU, retention, session length and more - across regions and genres. This enables us to create benchmarks that accurately reflect real-world conditions and player preferences.
This report serves as a comprehensive guide for game developers, publishers, and studios looking to optimize their games and stay ahead of the competition. With these actionable insights, you can:
- Evaluate game performance: Benchmark your games against industry standards to identify strengths and areas for improvement.
- Drive better decision-making: Inform decisions on user acquisition strategies, monetization models, and content updates based on data-backed trends.
- Understand regional and genre-specific trends: Highlight behavioral differences across regions and genres to localize strategies and explore new opportunities.
- Support game ideation and development: Provide insights for early ideation to align your game with proven player behaviors and preferences.
By leveraging these benchmarks, developers can make data-backed decisions to enhance user acquisition, engagement, and monetization strategies. Let’s dive into the data and explore the latest trends shaping the mobile gaming landscape.
Key highlights
Retention is the cornerstone of success
Retention remains the most critical metric for understanding game health and player loyalty. In 2024, D1 retention rates dropped slightly, with the top 25% of games achieving approximately 26-28%, and the bottom 25% struggling at 10-11.5%. Platforms show clear differences, with iOS outperforming Android in D1 retention. Long-term retention (D28) reveals even greater challenges, as 75% of games fail to exceed 3%, highlighting the importance of content pacing, progression, and long-term engagement strategies.
Engagement patterns tell a clear story
Median data display following engagement trends:
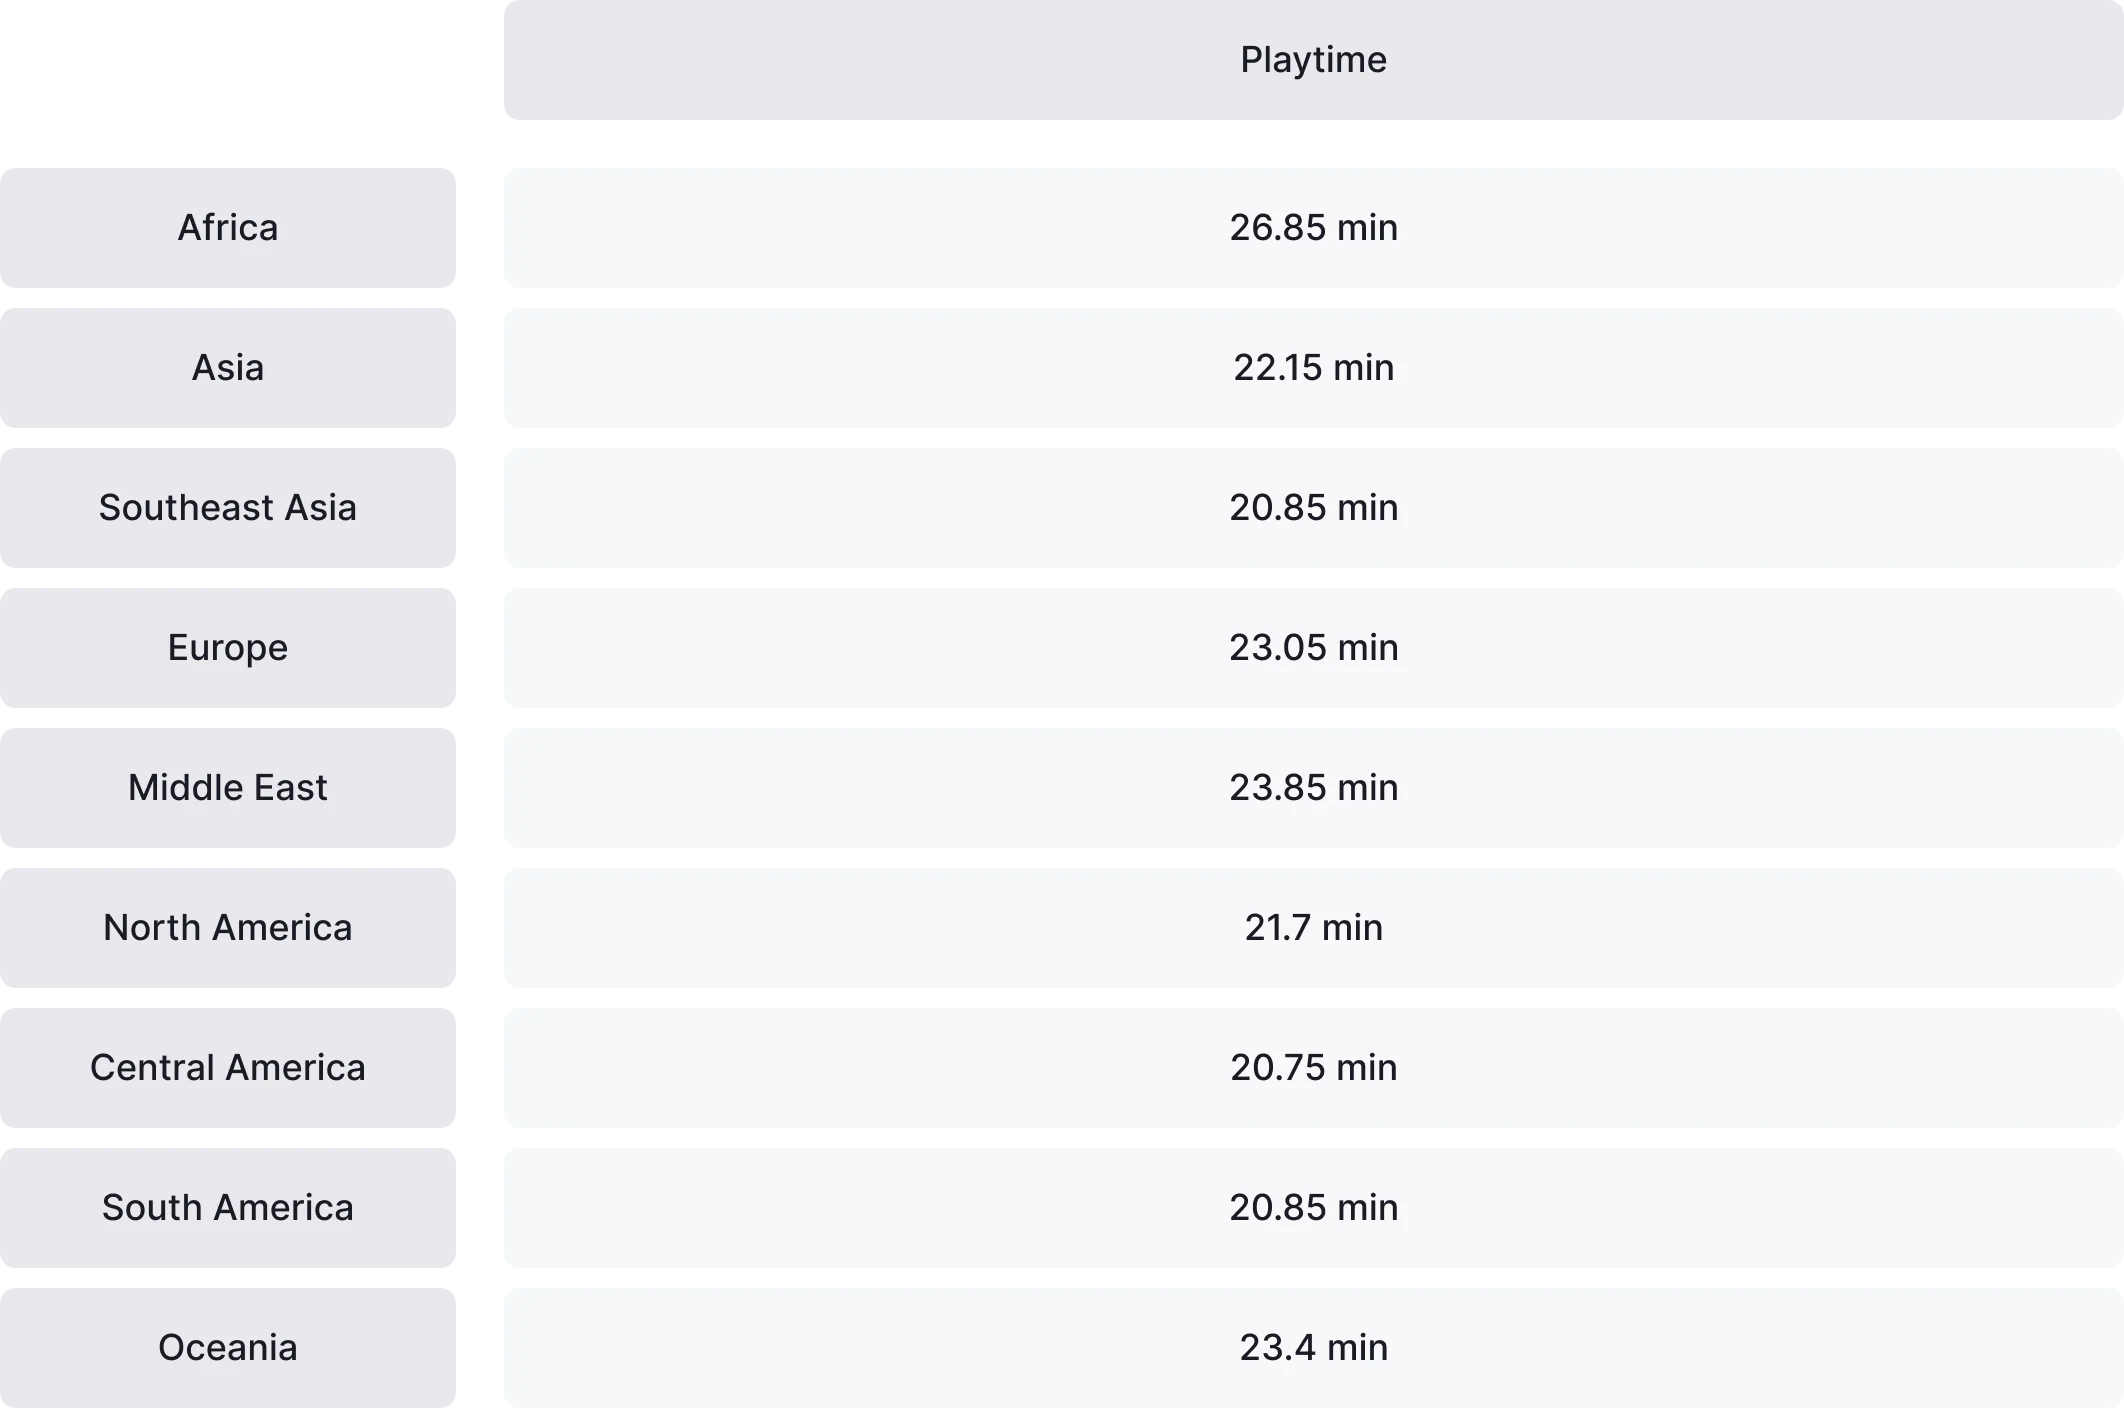
- Playtime: The median playtime in 2024 was around 22 minutes, with the top 2% of games exceeding 4 hours, driven by immersive platforms like Roblox (mobile). Africa leads with 26.85 minutes, reflecting intense but short-lived engagement.
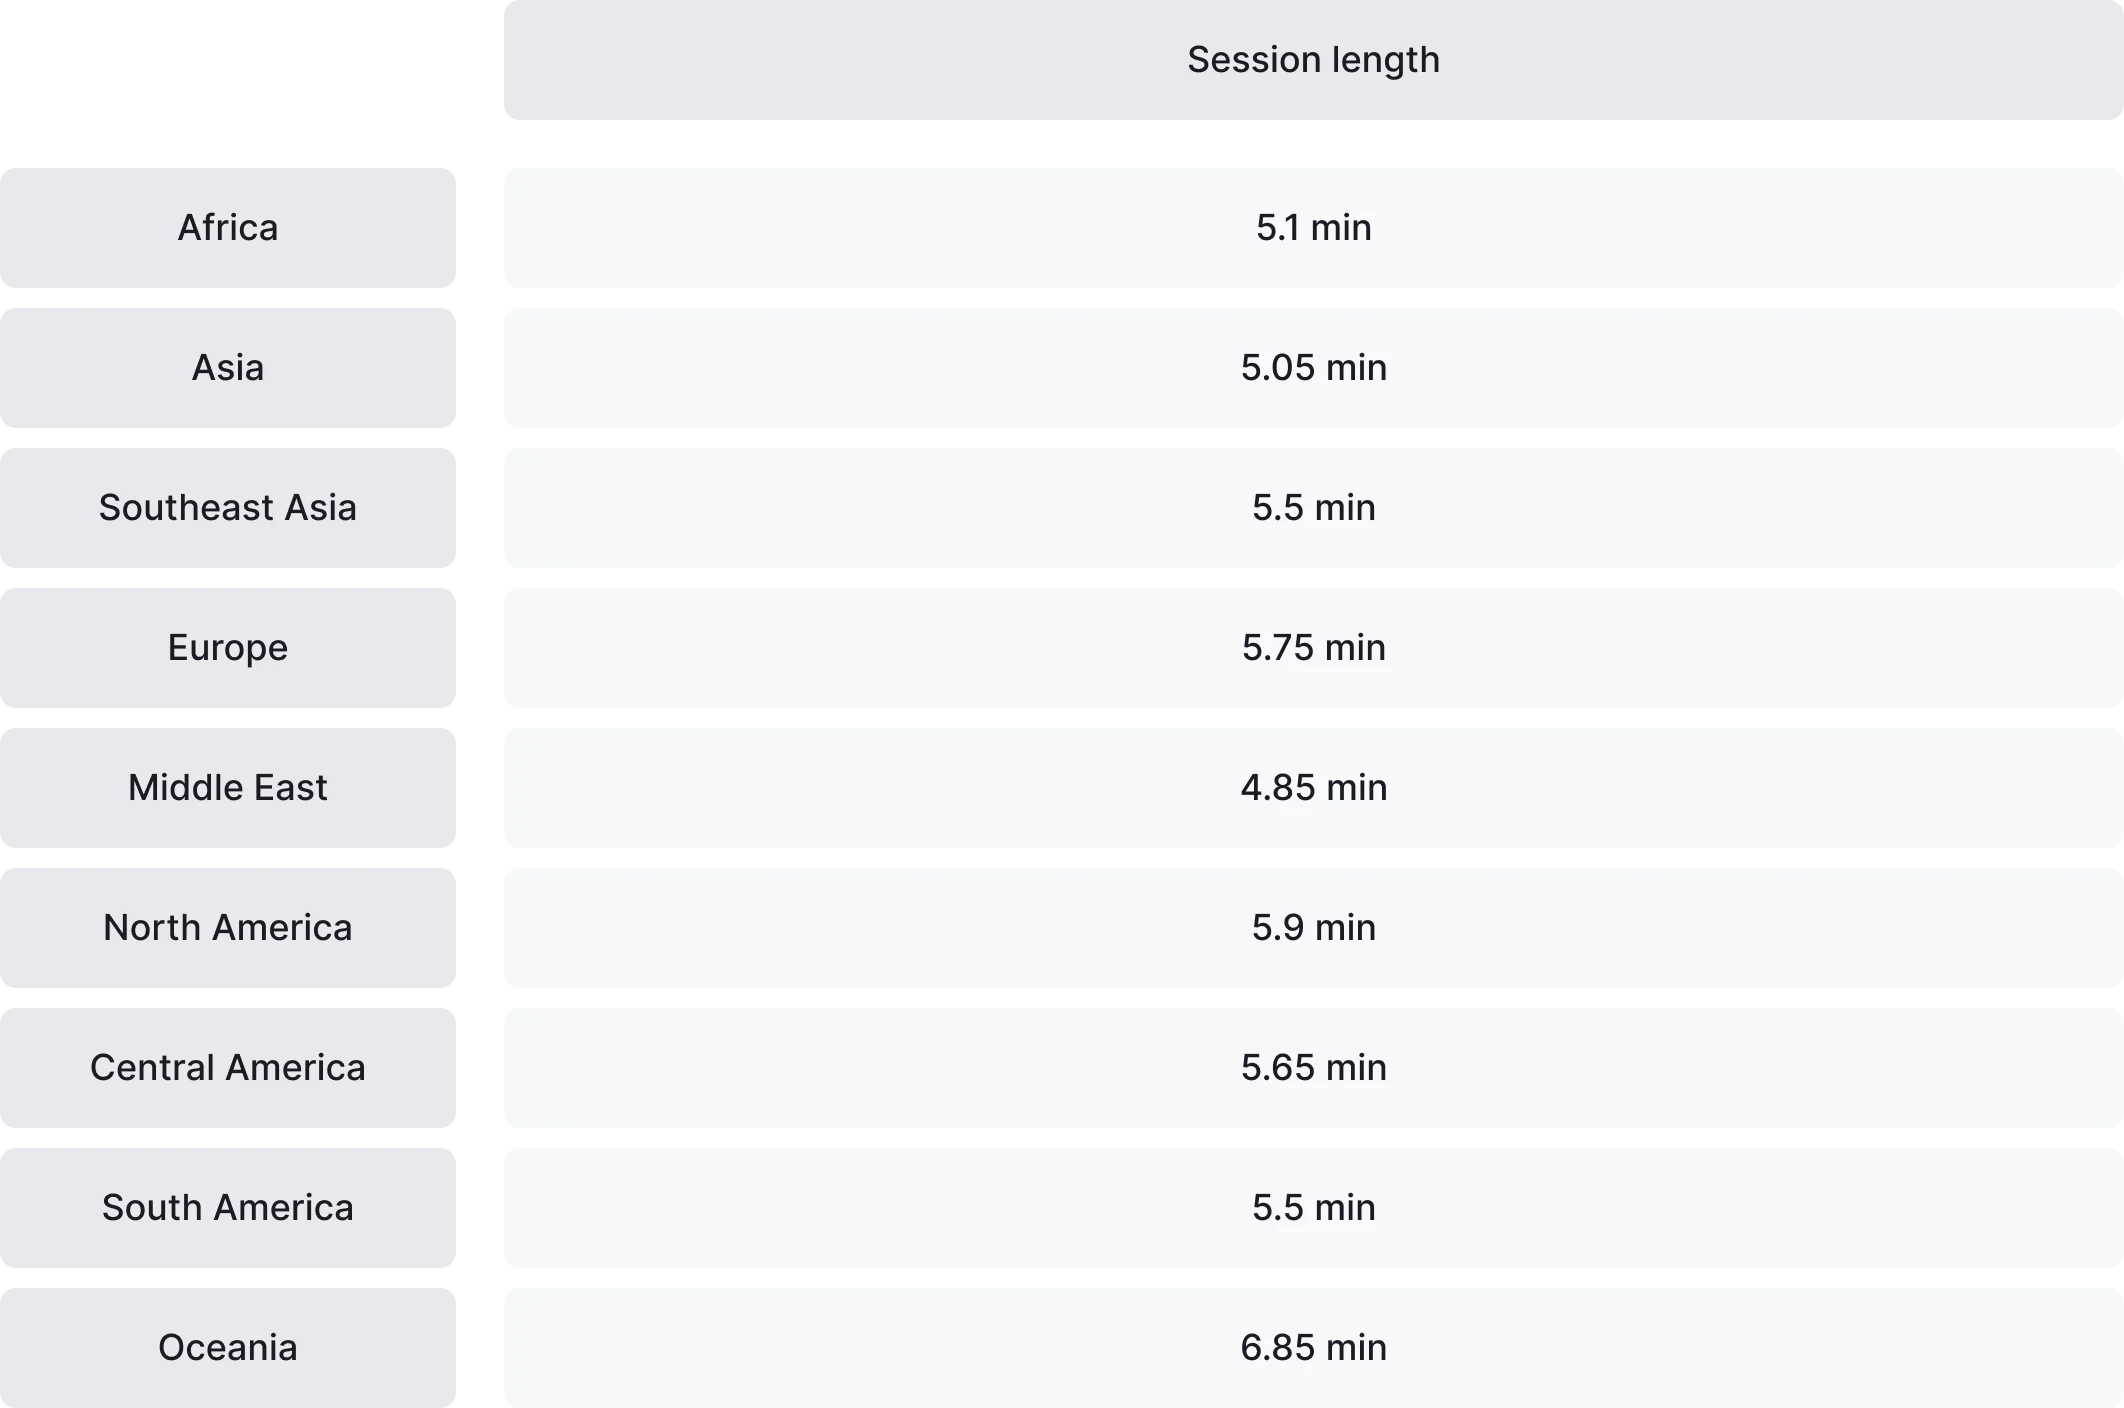
- Session length: Oceania leads with median session length of 6.85 minutes, indicating a preference for fewer but immersive sessions, while Africa and Asia show shorter sessions around 5 minutes, likely favoring quick gameplay bursts.
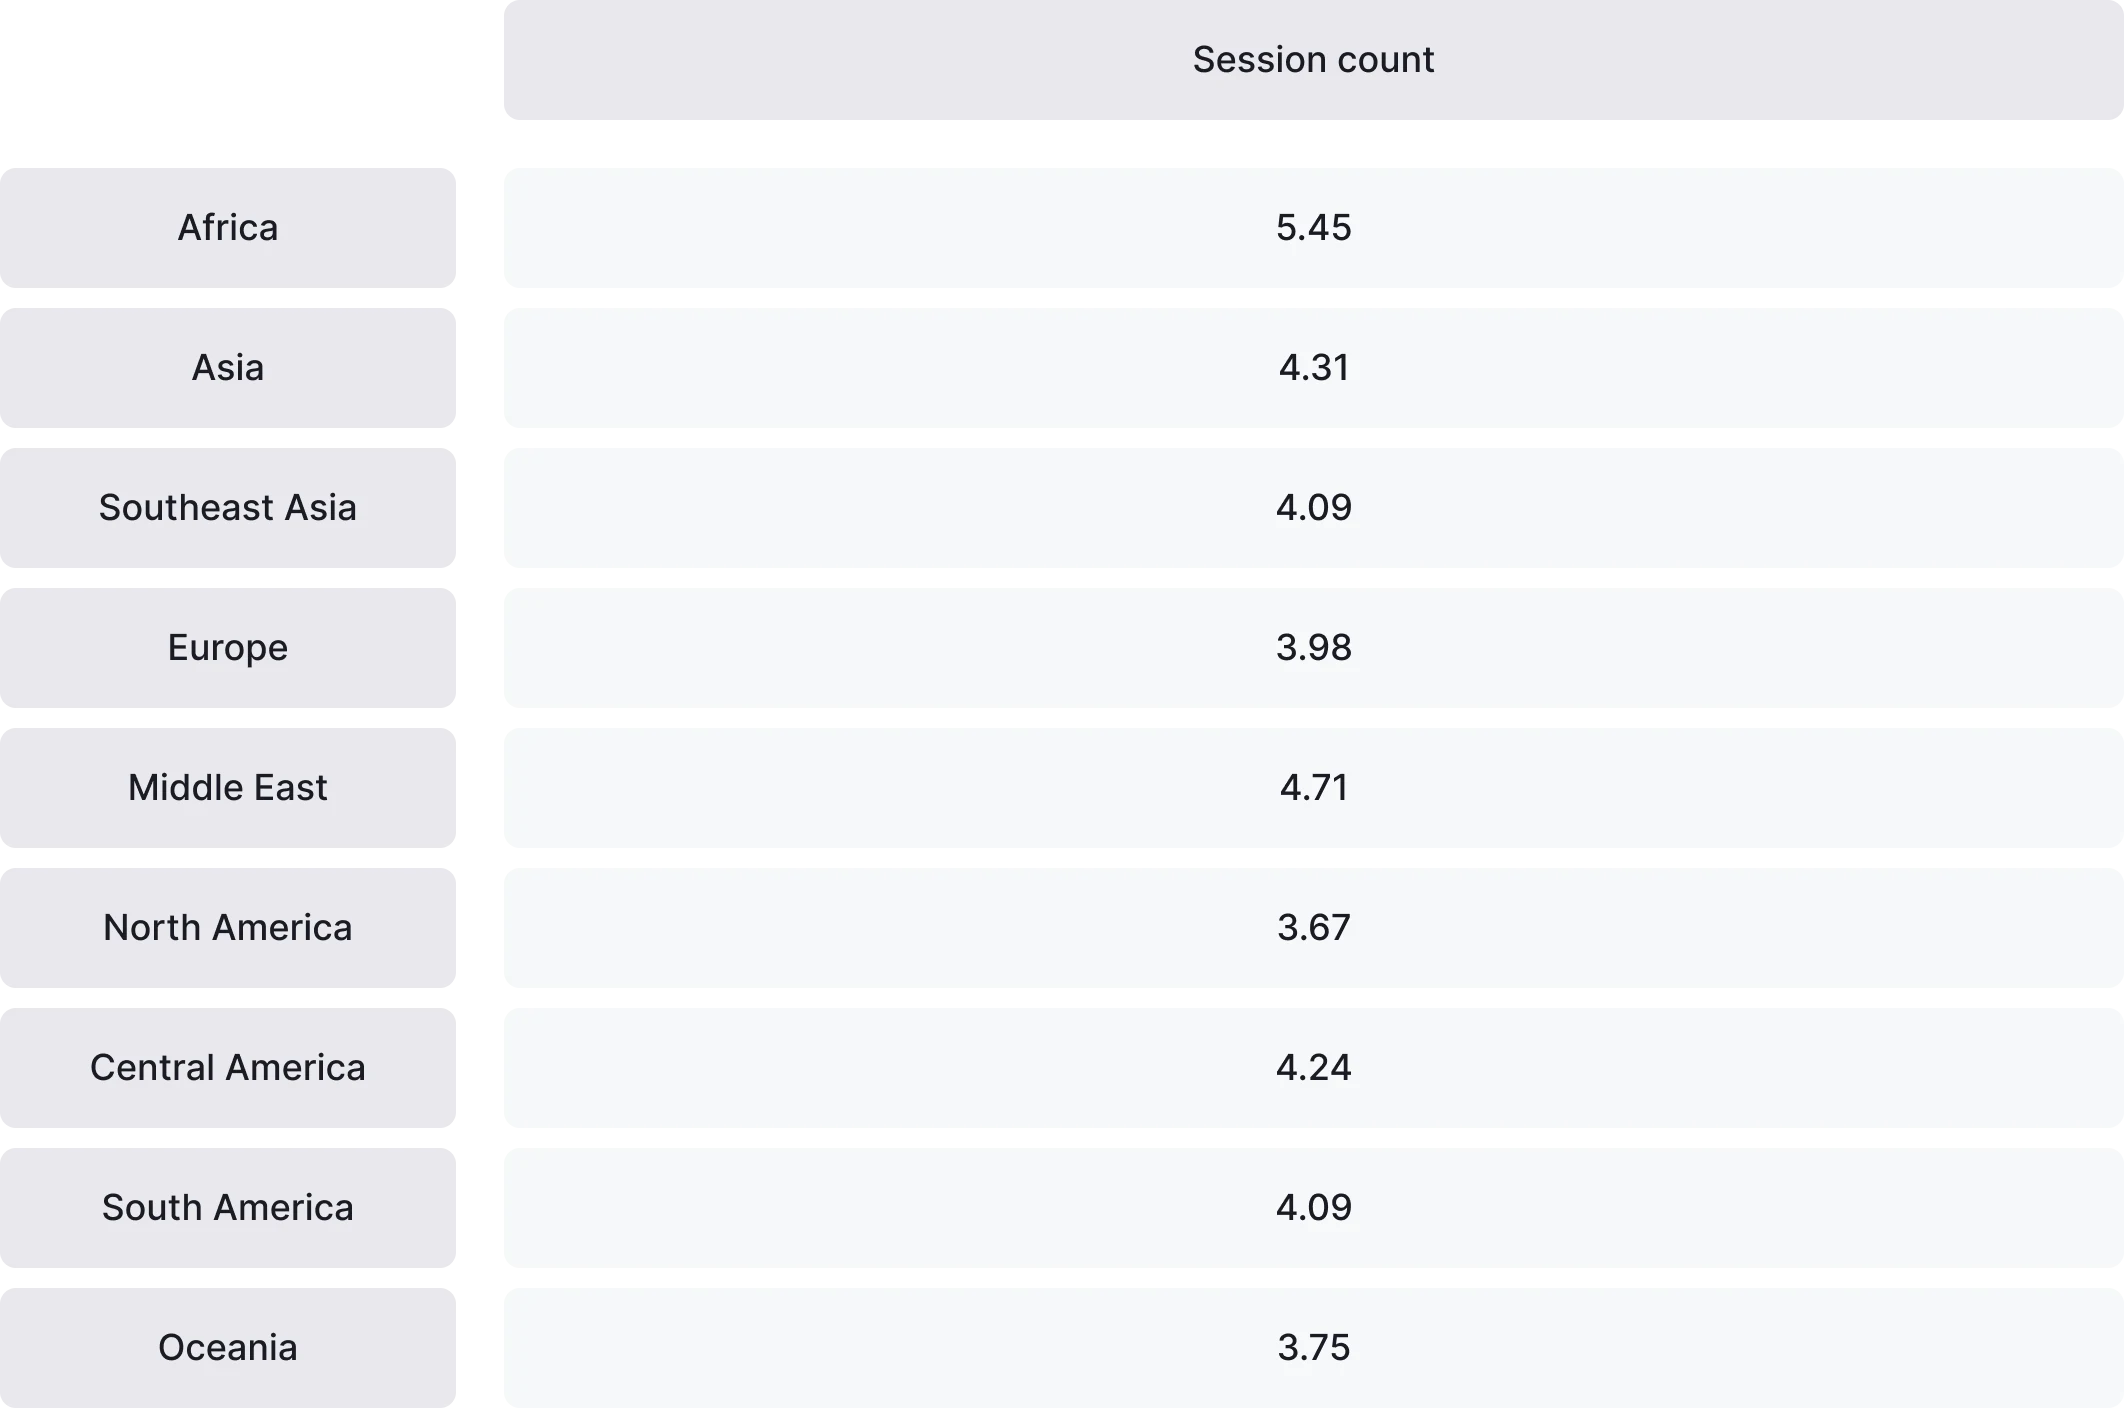
- Session count: Africa and the Middle East show the highest median session counts, indicating frequent re-engagement despite shorter session lengths. Oceania and North America favor fewer sessions paired with longer game play.
Regional differences matter
Regional median data shows diverse player behavior:
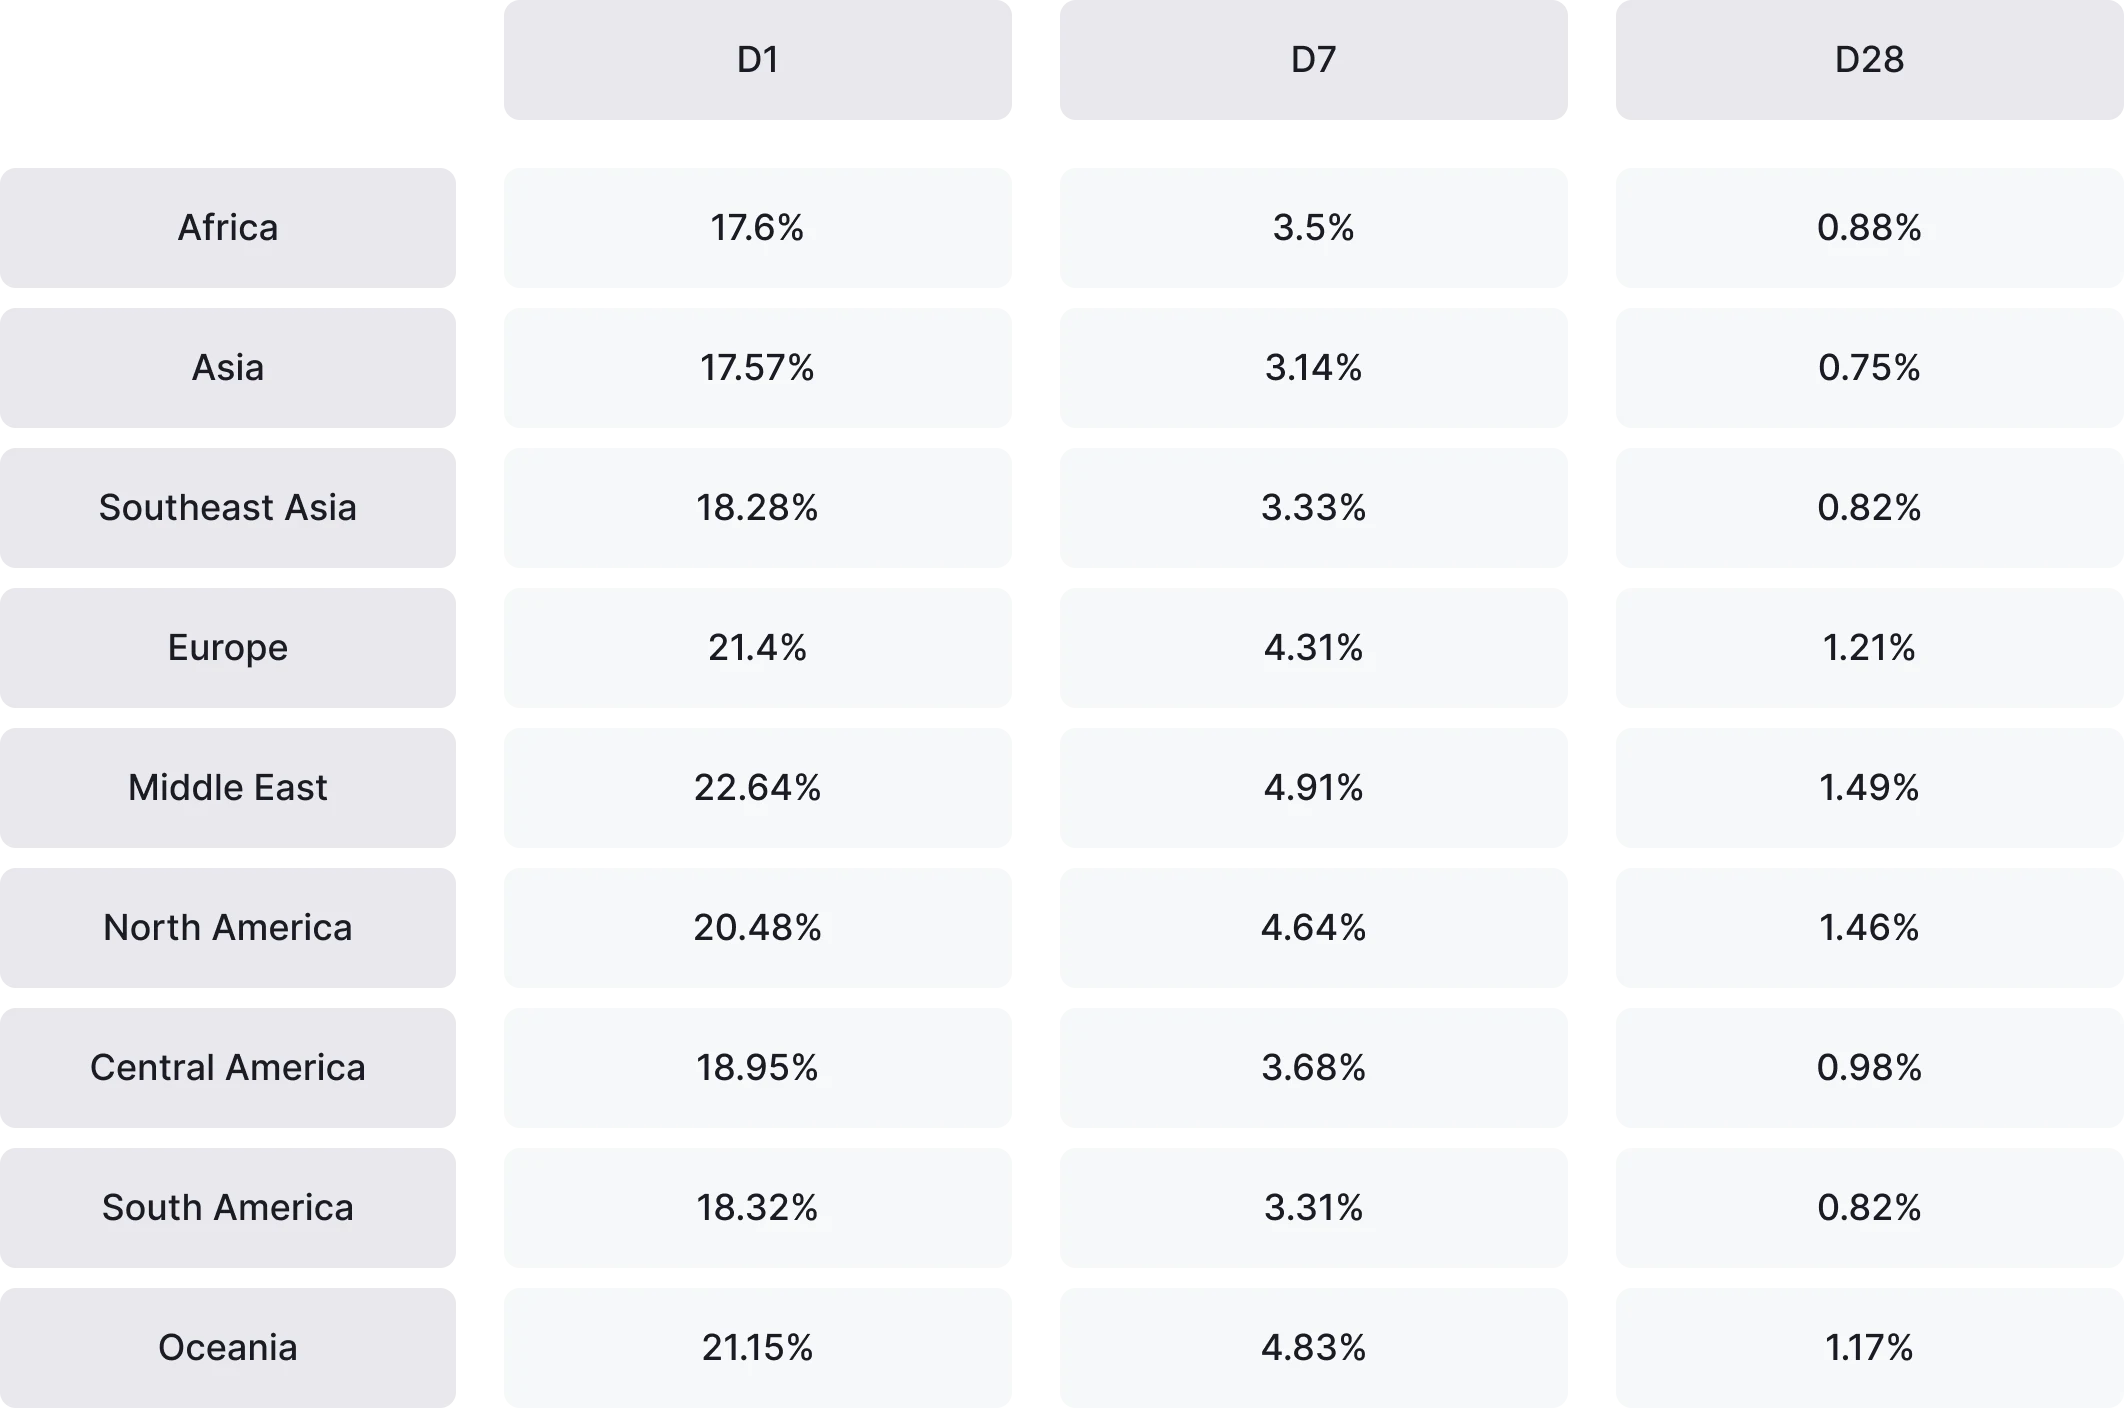
- The Middle East leads the median retention charts with D1: 22.64%, D7: 4.91%, and D28: 1.49%.
- Africa and Asia struggle with retention but lead in session counts, indicating short-term engagement opportunities.
- Europe and North America perform consistently well, reflecting strong median retention and engagement.
Player behavior varies by genre
From a median genre perspective, this is what we see:
- Board, Card, and Puzzle games display highest median short and long-term retention, with playtime and session count also ranking high.
- The median multiplayer games face challenges retaining players. However, they deliver the longest session lengths across all genres.
- The median classic games overall continue engaging players the most, consistently displaying good retention and engagement.
Methodology
The data in this report is sourced from a sample of mobile games integrated with GameAnalytics (11,600), spanning 9 regions, two platforms (iOS and Android), and 16 genres. This comprehensive dataset provides a reliable foundation for analyzing global and genre-specific benchmarks in mobile gaming.
To compile the line charts in the Global benchmarks chapter, we analyzed weekly global data across the top 25%, bottom 25%, and the median 50% of games. This data combines insights from iOS and Android, across all genres and regions for a full overview.
In the Regional insights chapter, we calculated yearly averages of weekly data for each region. These metrics include both operation systems, all genres, and are limited to the median 50% quantile, providing a snapshot of regional trends and performance.
For the Genre performance chapter, we used the median 50% quantile only, segmented by individual genres. The data is presented as monthly cohorts, reflecting performance trends within each genre.
- 1.48B average MAU: This report is based on insights gathered from an average of 1.48 billion monthly active users, offering an unparalleled view of player behavior and trends worldwide.
- Data from 11,600 games: Data was collected from 11,600 games, providing robust and diverse insights across multiple regions, platforms, and genres. It's worth noting that, on average, each game was published in at least 4.69 regions.
- Jan 1st - Dec 31st 2024: All metrics and benchmarks presented in this report reflect data collected throughout the 2024 calendar year, ensuring the insights are fresh and relevant to today’s mobile gaming landscape.
Global benchmarks
Retention
Let’s dive into retention, one of the most critical metrics for understanding the health and success of a mobile game. Retention measures the percentage of players who return to your game after their initial play session, typically tracked on key milestones like Day 1 (D1), Day 7 (D7), and Day 28 (D28). It’s widely regarded as the most critical metric in mobile gaming as it directly impacts every aspect of a game’s lifecycle—notably, user acquisition, monetization, and player engagement.
Retention is the foundation of a sustainable and prosperous game as it measures how well your game resonates with players over time. A game with poor retention won’t survive long, regardless of how many users are acquired. Conversely, strong retention indicates players are finding value, enjoyment, or a reason to return.
D1 retention
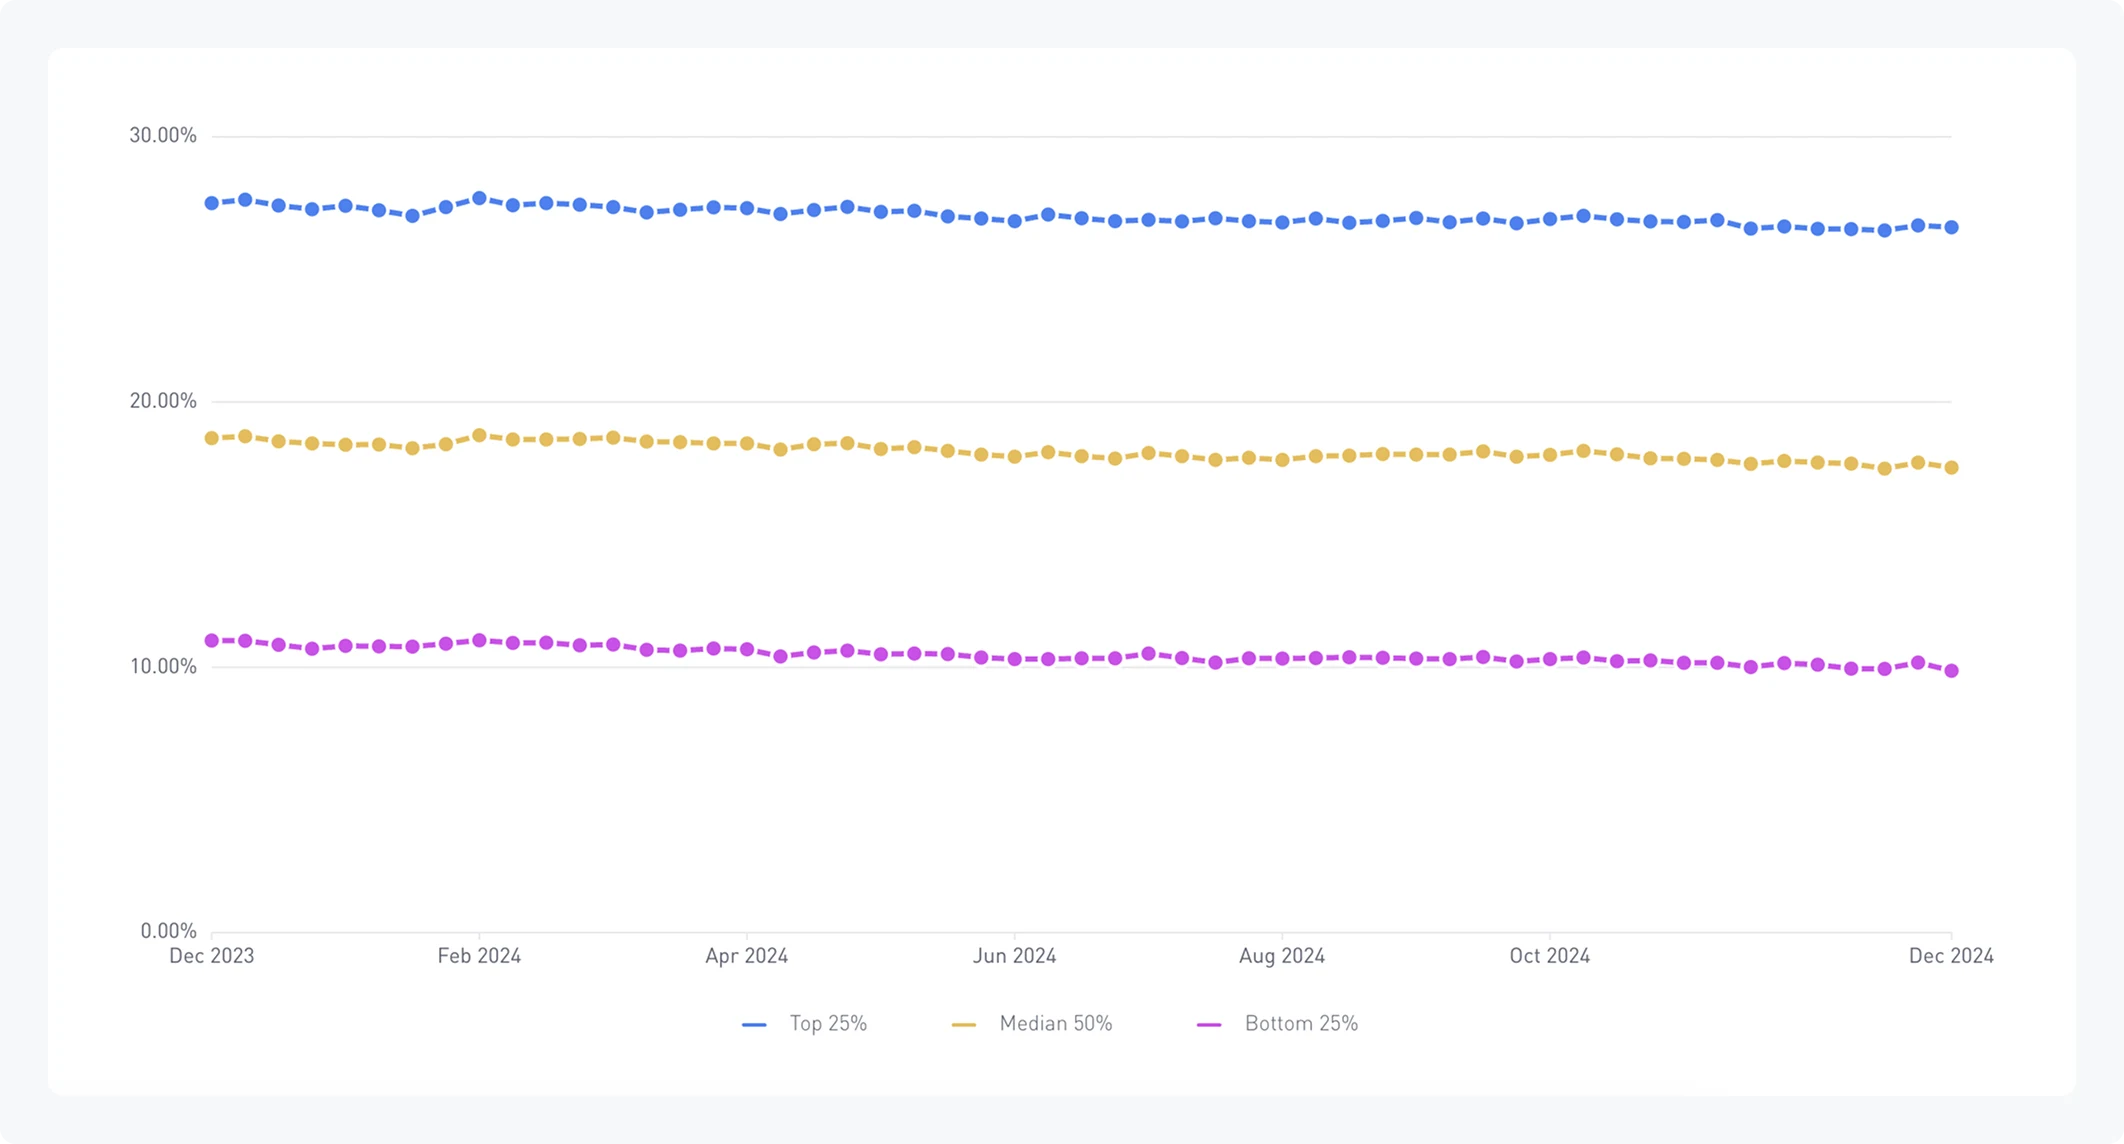
In 2024, Day 1 retention rates across mobile games hovered around 28-29%, but 2024 saw a noticeable decline, with even the top-performing games struggling to maintain high early engagement. Among the top 25% of games, D1 retention rates ranged between 26.48% and 27.69%, indicating a tightening in player retention across the board. At the other end of the spectrum, the bottom 25% of games displayed only 10-11.5% retention rates, highlighting the challenges underperforming games face in capturing and holding player interest.
Day 1 retention rates show a clear platform difference, with iOS games outperforming Android. Among the top 25% of games, iOS retention ranged between 31-33%, while Android games achieved only 25-27%.
D7 retention
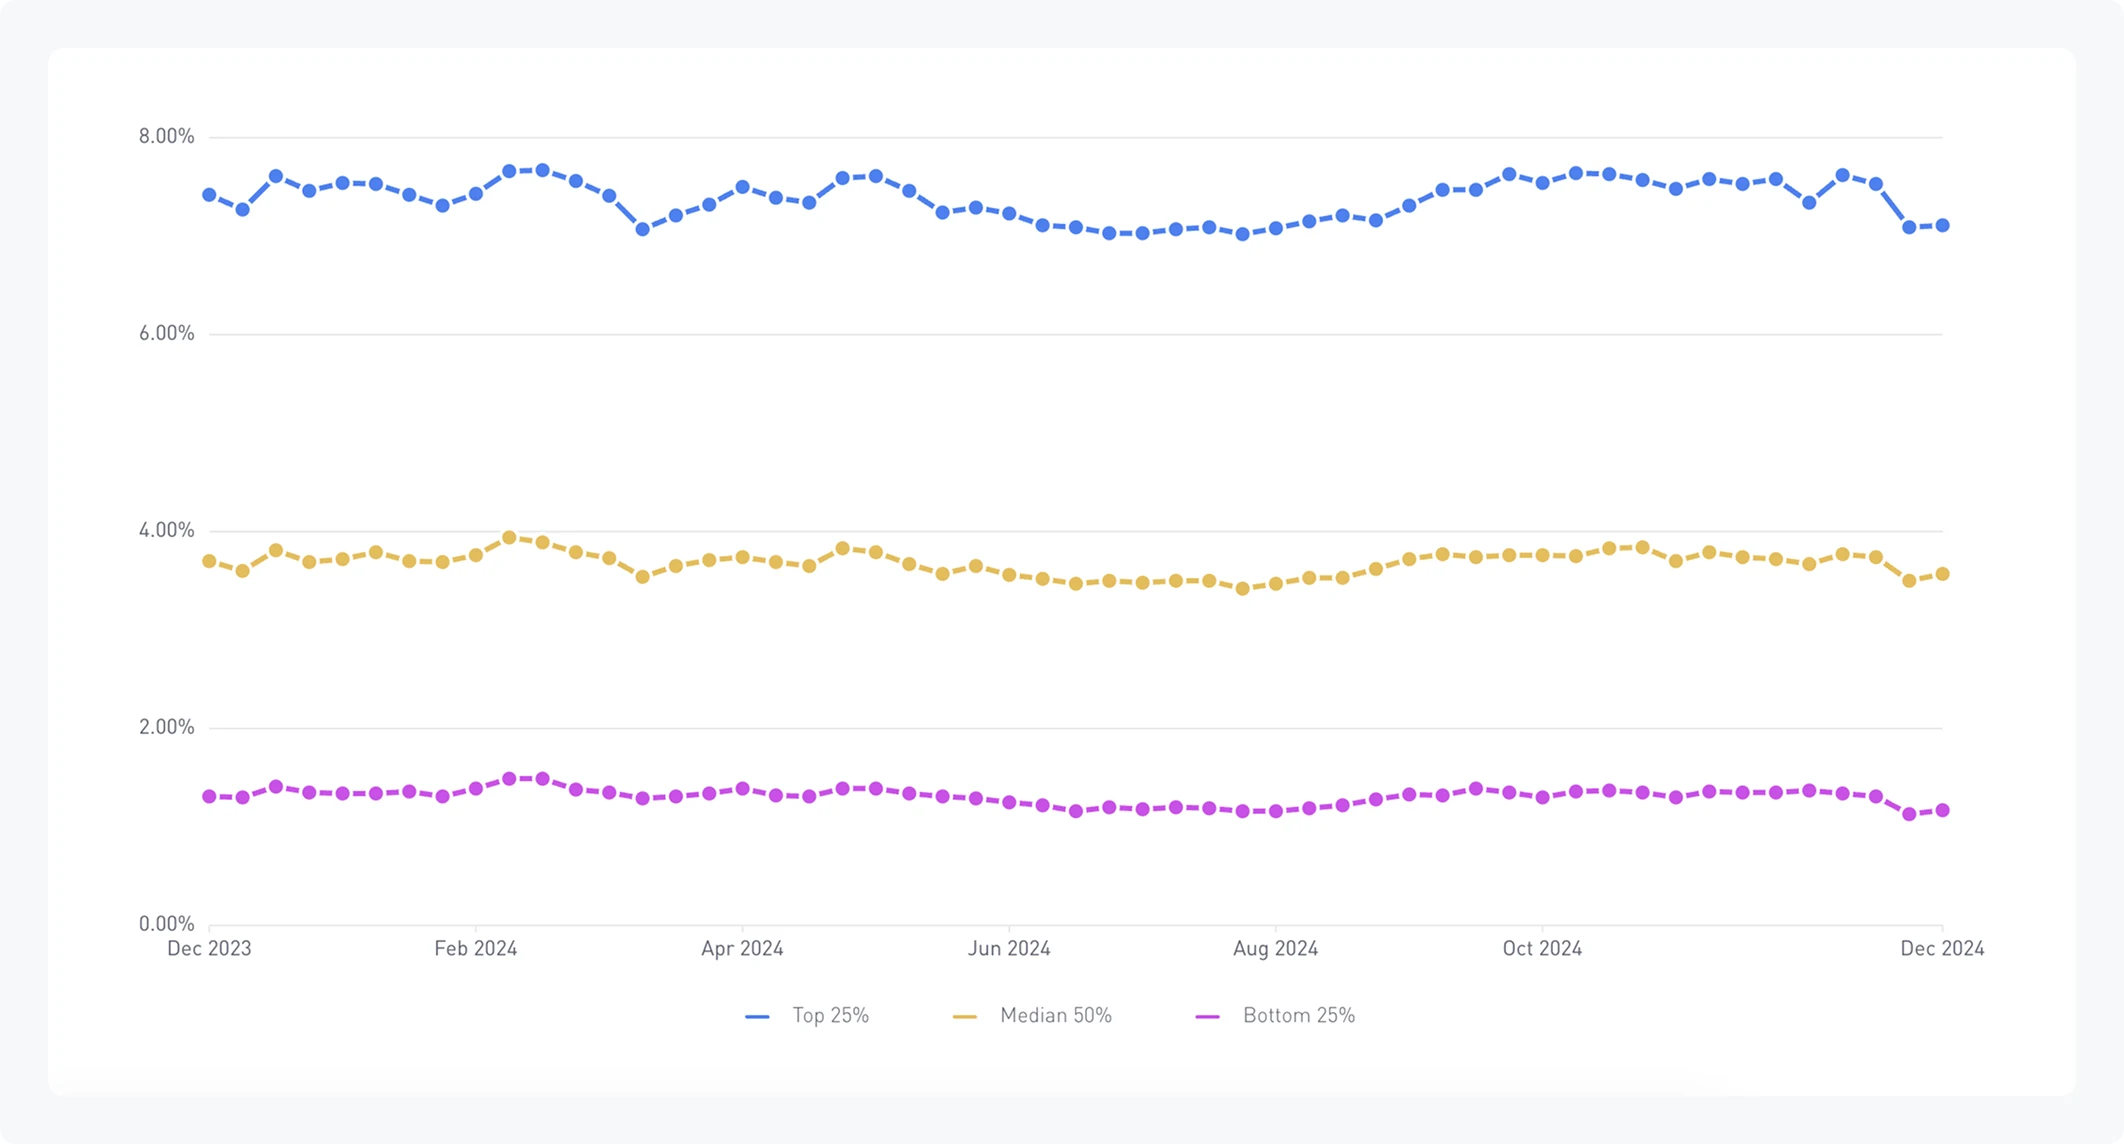
In 2024, Day 7 retention rates revealed a drop-off in player engagement. The median 50% of games displayed retention rates between 3.42% and 3.94%, while the bottom 25% barely reached 1.5%. Even among the top 25%, rates ranged only between 7% and 8%, highlighting the growing challenge of maintaining player interest beyond the first week. In comparison to 2023, D7 retention rates in 2024 show a clear decline in player engagement. Last year, the median 50% of games had D7 retention rates around 4-5%, slightly higher than the 3.42% to 3.94% observed in 2024.
Retention and its correlation with user acquisition
Retention and user acquisition (UA) are deeply interconnected. High retention rates:
- Boost UA ROI: If players stick around, the cost of acquiring them is spread over a longer engagement period, increasing the ROI.
- Impact ad campaign efficiency: Games with higher retention perform better in ad campaigns, as platforms like Facebook and Google prioritize games that generate longer-term engagement.
- Lower churn rates: Retention helps reduce churn, meaning fewer dollars are wasted acquiring players who abandon the game after one session.
In contrast, low retention rates can quickly deplete UA budgets, as constant replacement of lost players drives up acquisition costs.
D28 retention
Even though Day 28 is far removed from the initial download, it provides critical insights into your game's long-term health and sustainability.
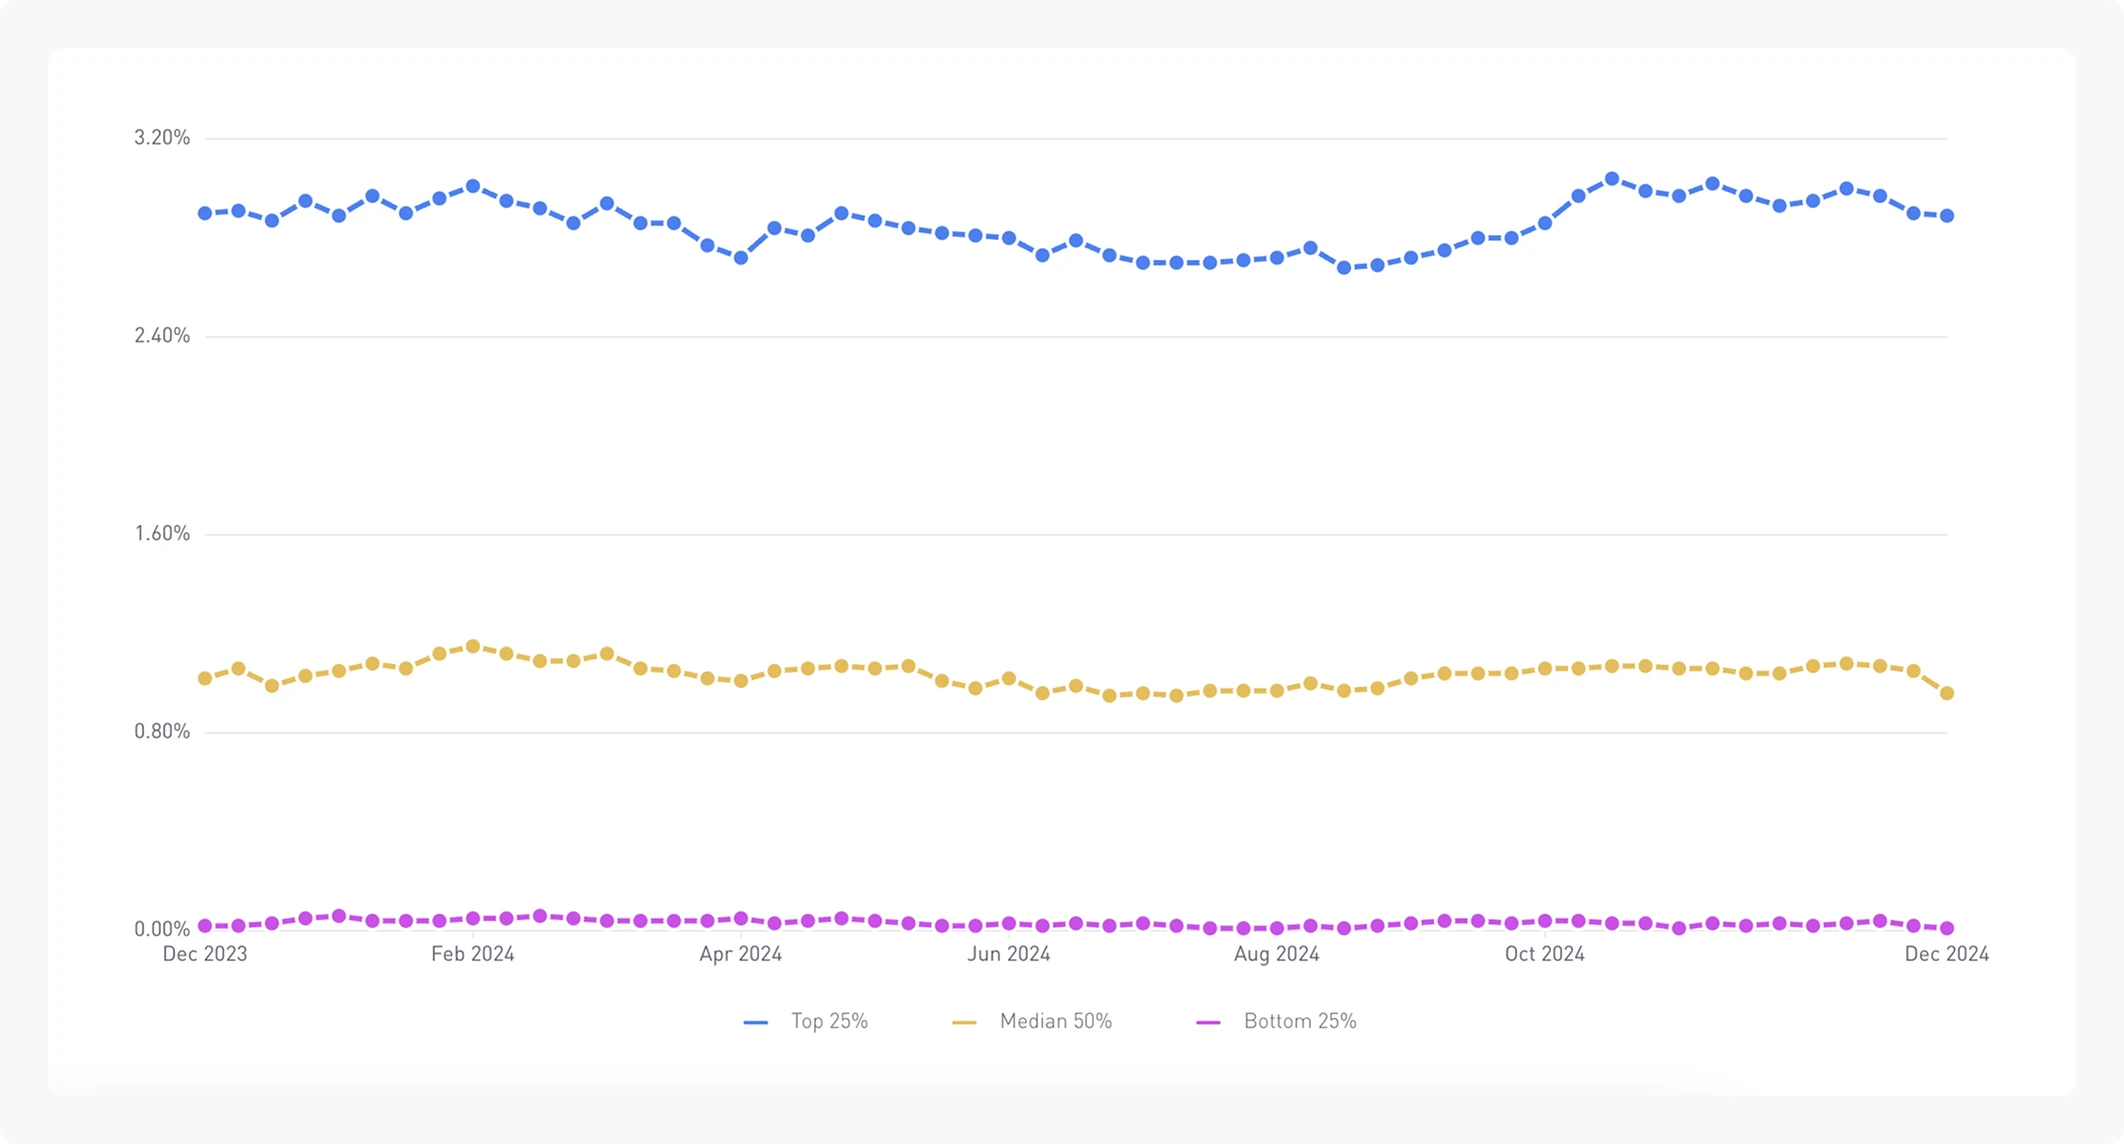
In 2023, D28 retention rates for mobile games were already challenging, with most games struggling to keep players engaged long-term. Last year, this trend worsened, with 75% of games failing to exceed a 3% D28 retention rate. This highlights the growing difficulty in sustaining player interest over time, making D28 retention an increasingly critical metric for identifying and addressing issues in content pacing, progression systems, and long-term player satisfaction.
Retention’s influence on monetization
Retention is directly tied to monetization as players must spend time in the game to generate revenue. Here’s how it plays out:
- In-app purchases (IAP): Players who stick around longer are more likely to spend on IAP, as they have more time to see value in the game.
- Ad revenue: Retained players view more ads over time, increasing overall ad impressions and revenue potential.
- Lifetime value (LTV): Retention impacts the LTV of players—the total revenue a player generates over their lifecycle. The longer players stay engaged, the higher their LTV.
Games with poor retention often struggle with monetization as users churn before they have a chance to spend money or contribute through ad engagement.
How to improve retention?
Now that you’ve seen the latest retention benchmarks, you can focus on ensuring your game performs alongside the best. High retention rates are the hallmark of successful games—they drive player loyalty, maximize monetization, and boost the ROI of your user acquisition efforts. To help you stay ahead of the competition, we’ve outlined 5 essential strategies that will help you keep players engaged and coming back for more.Here’s how to turn your retention insights into actionable improvements:
- Optimize onboarding: Make the first-time user experience (FTUE) seamless and engaging, with clear tutorials and early rewards to hook players from Day
- Strengthen core gameplay: Focus on making your core gameplay loop fun. Introduce increasing challenges, varied mechanics, and rewarding feedback loops that adapt to player skill levels to keep the experience fresh and engaging over time.
- Introduce progression systems: Keep players motivated with layered goals like leveling up, unlocking content, and completing missions that give a sense of achievement.
- Deliver fresh content regularly: Avoid repetition by rolling out new updates, seasonal events, or time-limited challenges to keep the game exciting and dynamic.
- Analyze and iterate based on player feedback: Use data and player feedback to identify pain points, refine mechanics, and make improvements that resonate with your audience.
What retention tells us about game content
Retention reflects how well your game’s content resonates with players and provides key insights:
- Onboarding (D1 retention): Highlights how effectively the game hooks players early. Low D1 retention often points to confusing tutorials or unappealing initial gameplay.
- Core gameplay appeal (D7 retention): Indicates if players find the core gameplay engaging. A drop by Day 7 suggests a lack of motivation or content depth.
- Content pacing (D28 retention): Shows whether the game offers enough fresh content or progression for long-term engagement. Low D28 retention signals repetition or stagnation.
Remember to keep player expectations by genre in mind—e.g., casual games tend to have high D1 but lower long-term retention, while midcore games maintain steadier retention.
Engagement
Playtime
Playtime refers to the total time a user spends actively engaging with a game in a single day, combining the durations of all sessions. It is a critical metric for understanding player behavior and engagement, highlighting how much time users dedicate to a game.
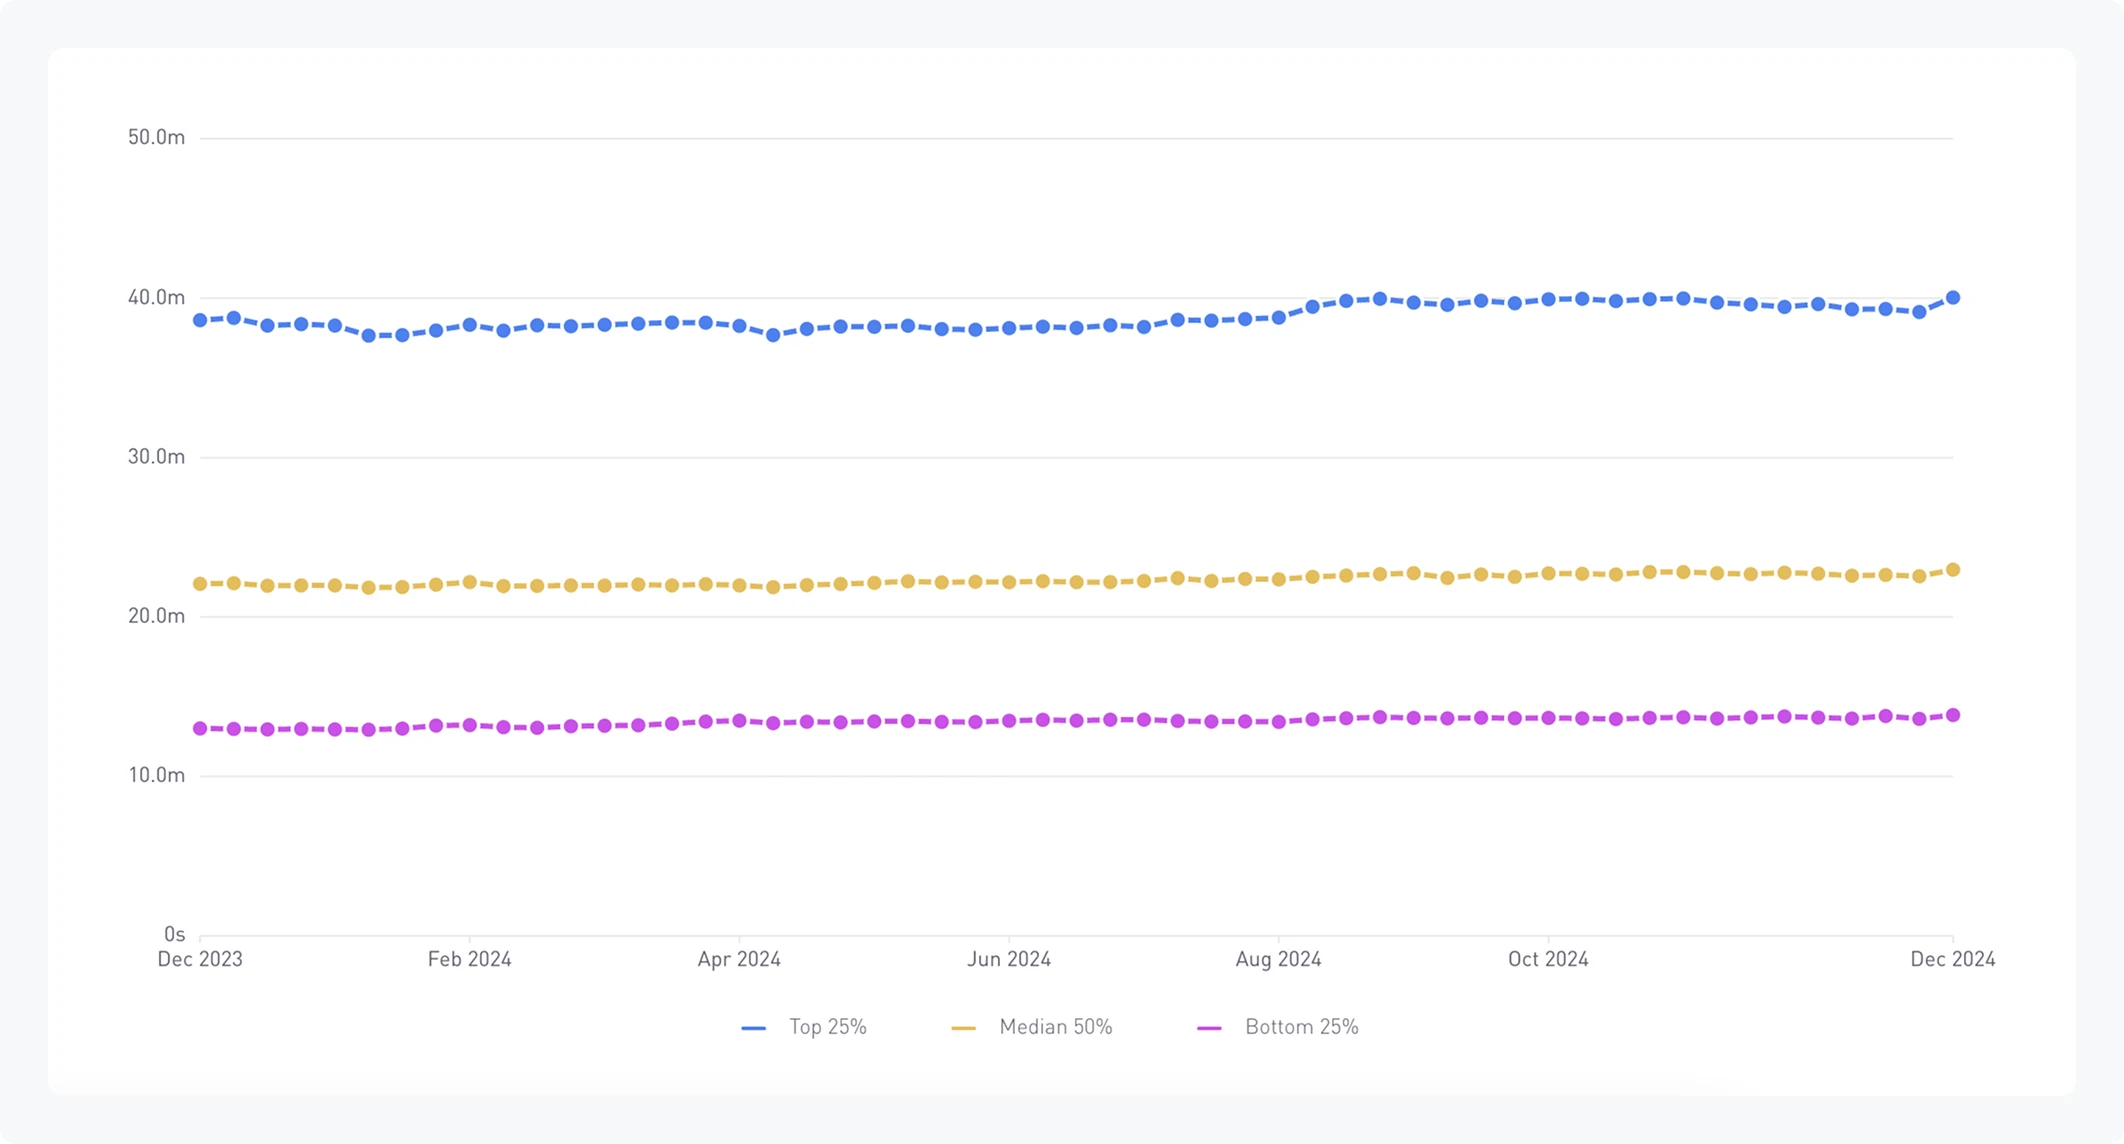
Daily playtime in mobile games has shown dynamic trends in recent years, with the median 50% of games averaging around 22 minutes in 2024. However, within the top-performing quantiles, the numbers are strikingly higher—our data reveals that the top 2% of games average well over 4 hours of daily playtime per user.
Roblox mobile games are major contributors to these trends. For instance, recent reports reveal that Australian children aged 4-18 spent an average of 137 minutes daily on Roblox in 2024 (The Guardian).
Session length
Session length measures the average duration of a single gaming session, indicating how long players typically play the game in one sitting. Longer session lengths suggest high player engagement and enjoyment, while shorter session lengths may indicate issues with pacing, content depth, or player frustration.
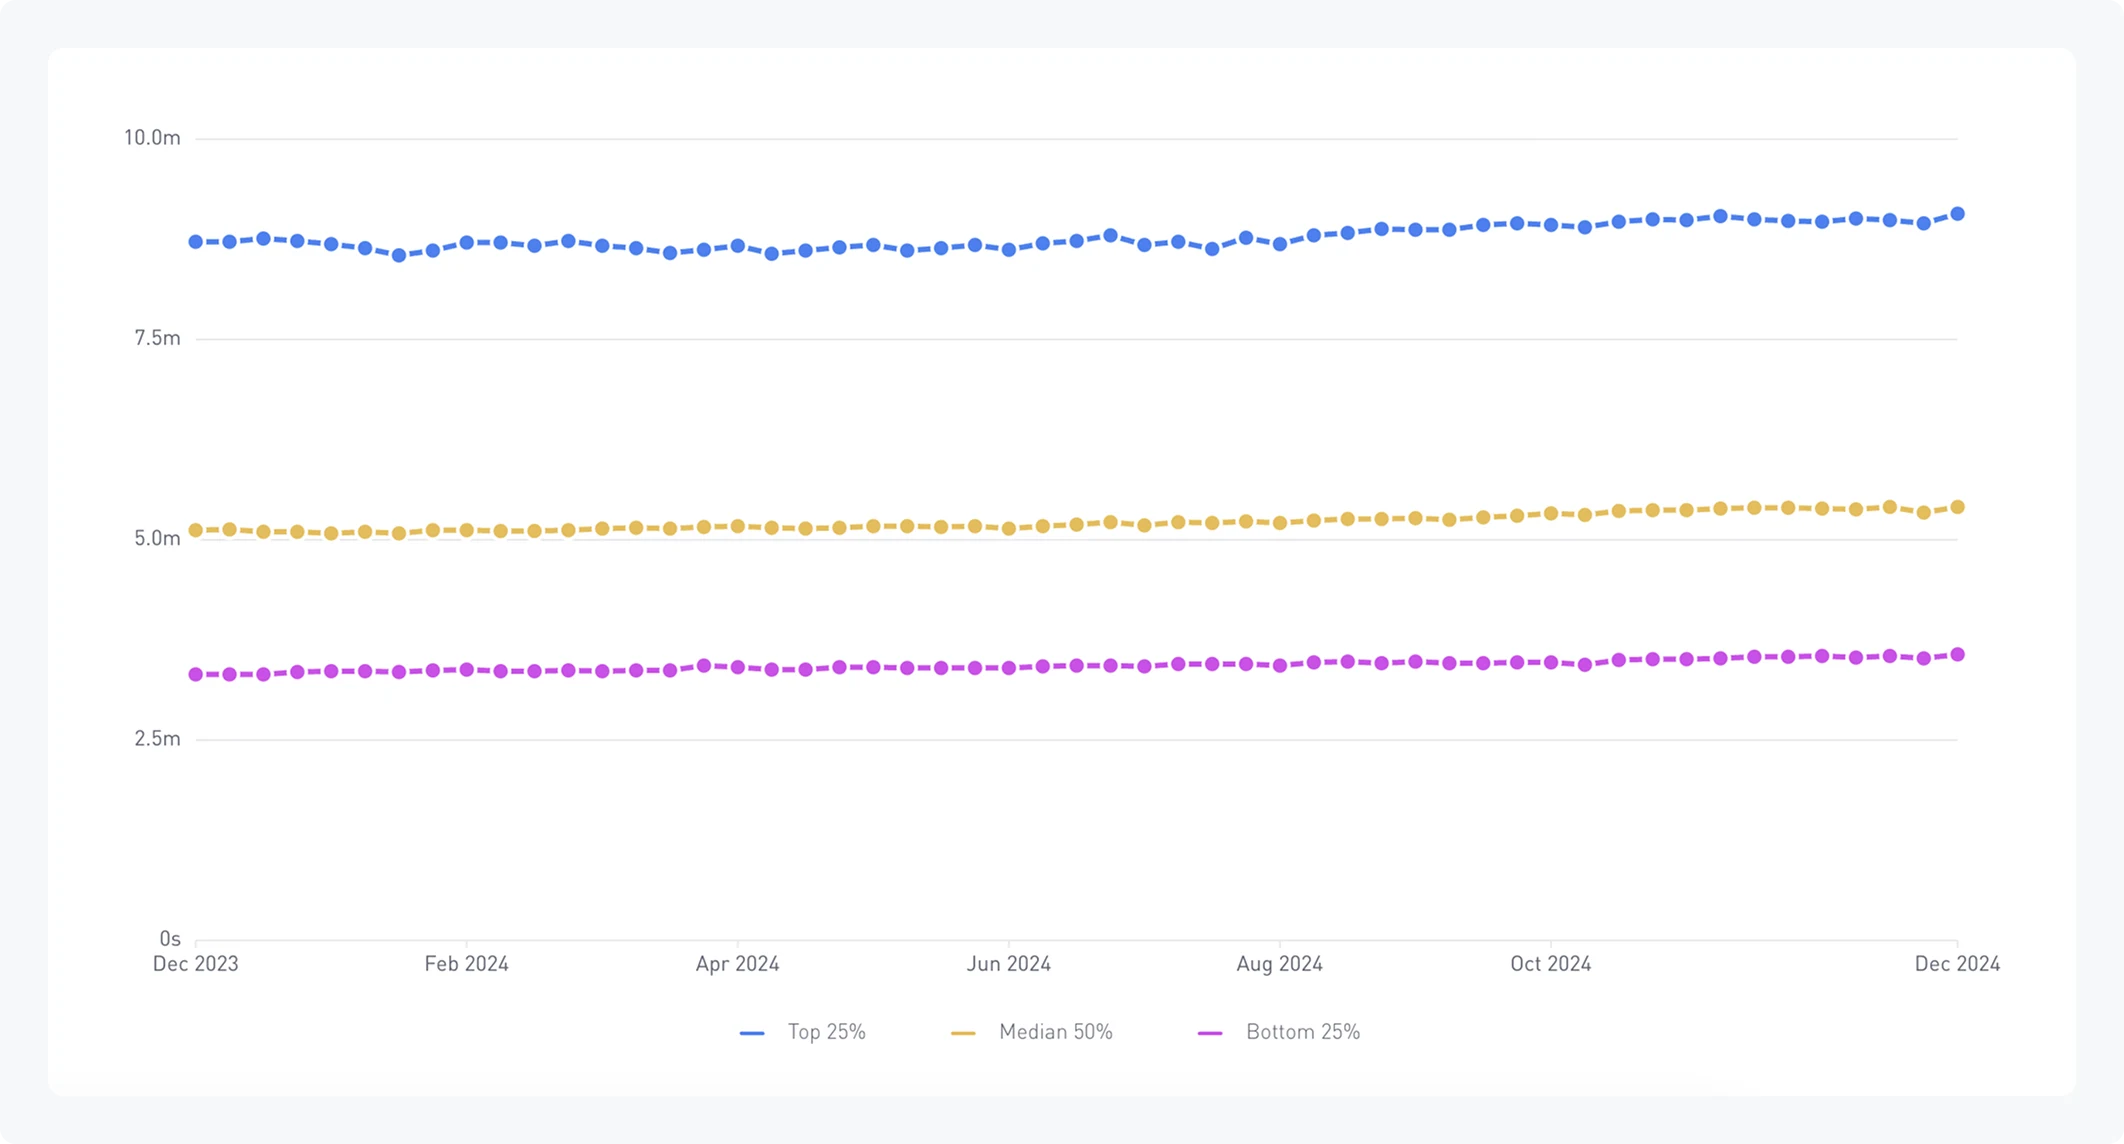
In 2024, session lengths among the top 25% of games averaged between 8 and 9 minutes, while the median 50% of games reported session lengths between 5 and 6 minutes. This aligns with the gradual trend over recent years where session lengths have shortened slightly, especially as casual and hyper-casual games dominate the market.
Historically, session lengths have been driven by game design and genre-specific behaviors. For example, casual and hyper-casual games often feature shorter sessions (5–6 minutes), focusing on bite-sized gameplay and frequent breaks. Midcore games, on the other hand, tend to range between 10–15 minutes, as players engage with more immersive gameplay.
Session count
Session count tracks the number of gaming sessions players initiate within a defined timeframe, providing insights into player engagement frequency and habits. Higher session counts indicate strong player engagement and interest in the game, while lower session counts may signal waning interest or competing priorities.
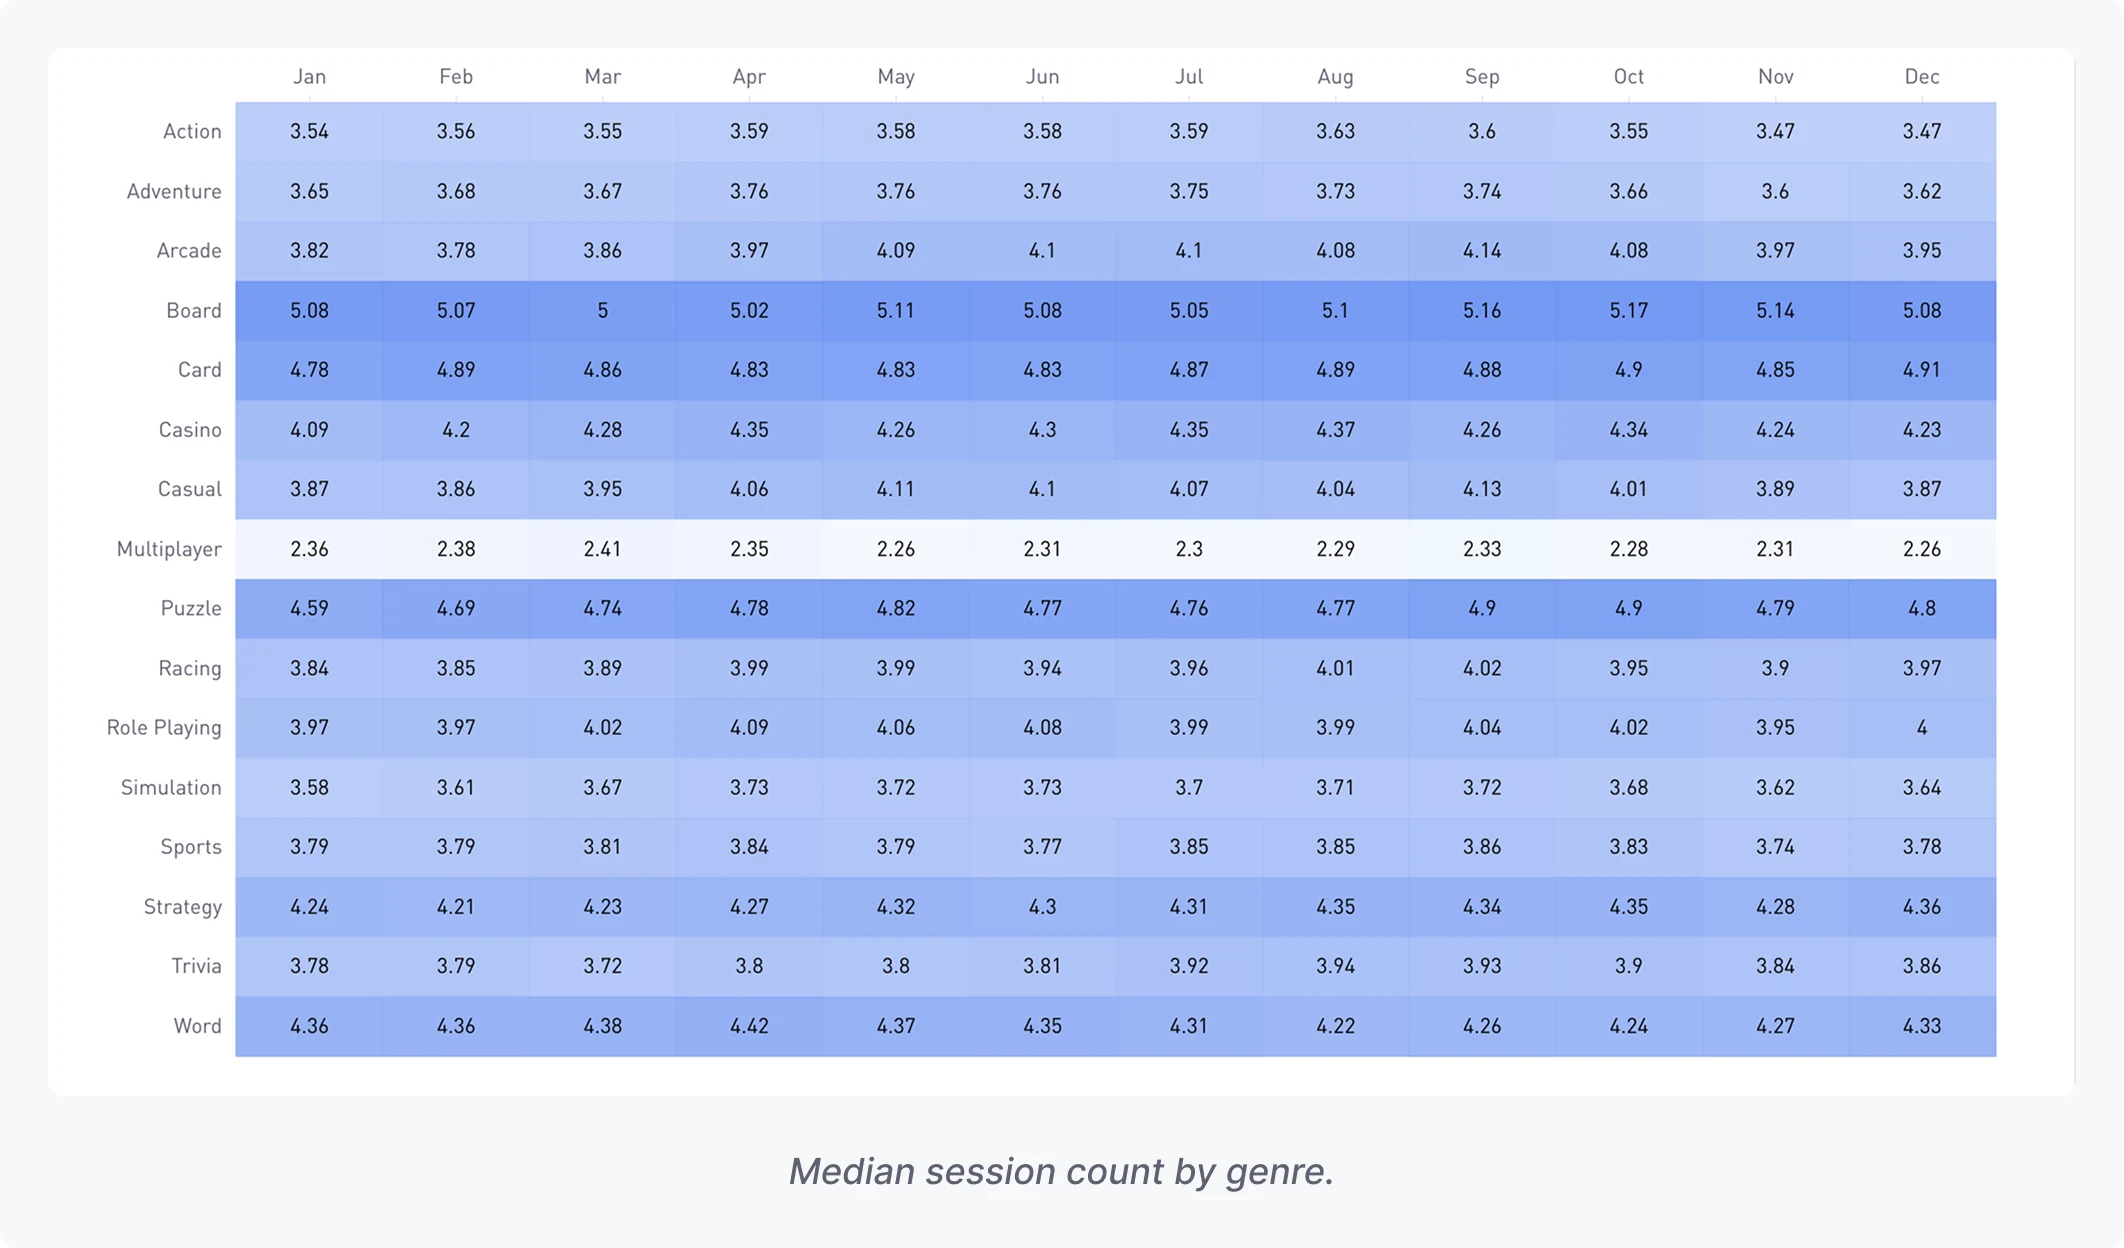
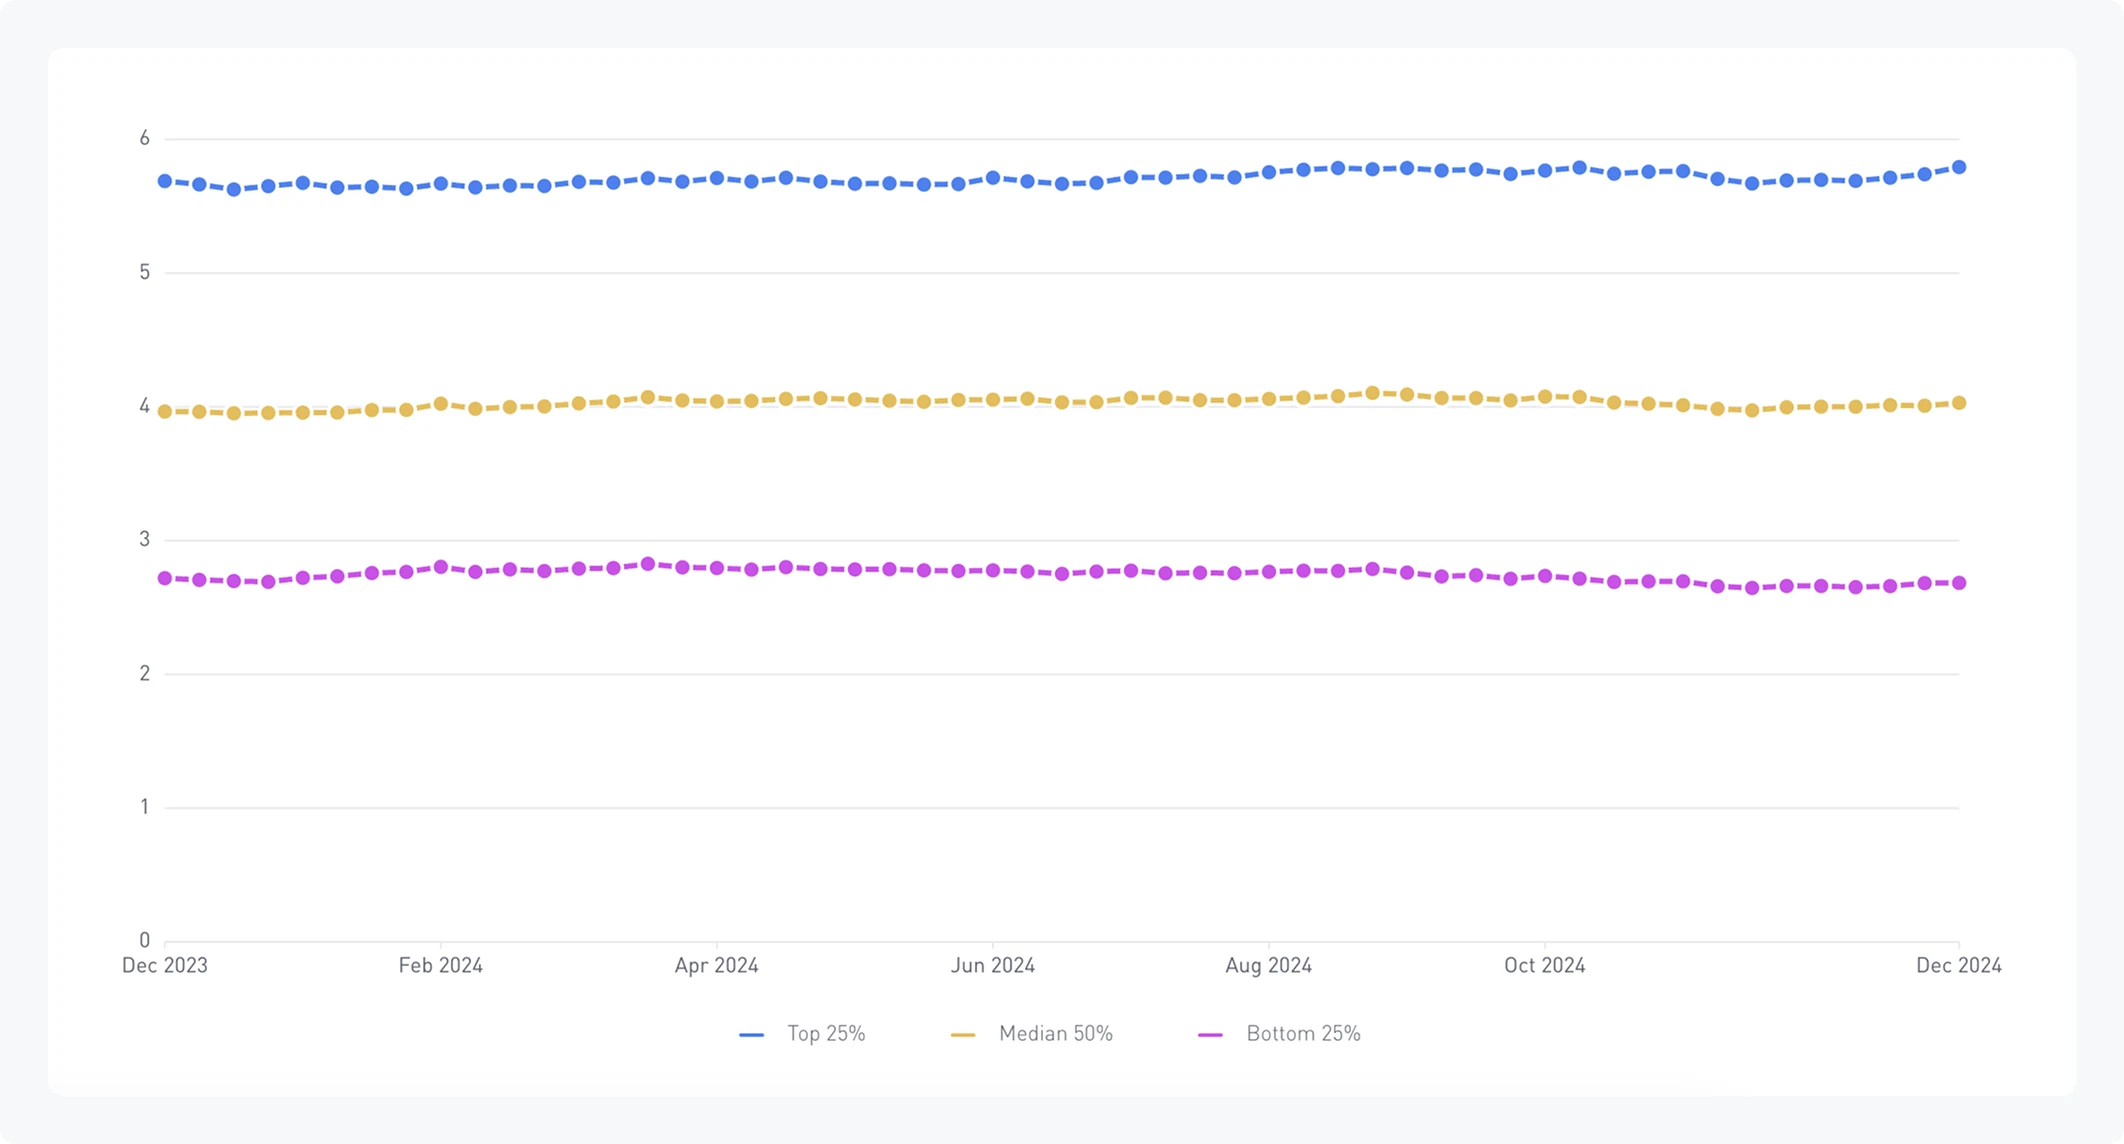
In 2024, the median session count across all mobile games was 4 sessions per day, reflecting a consistent level of engagement throughout the year. However, unlike retention rates, Android games outperformed iOS in this metric, with players on Android devices averaging more daily sessions than their iOS counterparts. This difference could be attributed to the prevalence of casual and hyper-casual games on Android, which encourage shorter, more frequent play sessions.
Among genres, mid-core games emerged as the best-performing category for session counts. In these games, even median performers reported between 6 and 7 sessions per day, far exceeding the average for other genres.
Regional insights
While the previous metrics provided a global view of game performance, the following pages breaks these metrics down by region, uncovering distinct player behaviors across markets. These regional insights highlight critical differences in engagement, retention, session lengths, and other key metrics, helping studios and publishers tailor their strategies more effectively.
Understanding regional trends can guide market entry decisions, such as prioritizing regions with higher retention rates or playtime. Additionally, these insights can inform ad targeting strategies, localization efforts, and even game design adjustments to align with cultural preferences.
The metrics presented in this chapter represent the median 50% of games within each region.
Retention
The Middle East leads median retention across all timelines, with the highest D1 (22.64%), D7 (4.91%), and D28 (1.49%), indicating strong engagement and loyalty. Europe and Oceania also perform well, with D1 above 21%. In contrast, Africa and Asia struggle with retention, particularly D1 and D28, highlighting the need for stronger onboarding and content or progression strategies.
Playtime
Africa tops median playtime at 26.85 minutes, showing deep engagement within shorter retention spans, while Europe, the Middle East, and Oceania average around 23 minutes, indicating balanced engagement and retention. Asia and Southeast Asia report the shortest playtimes, under 22 minutes, pointing to preferences for quick, casual gameplay experiences.
Session length
Oceania leads with the longest median sessions at 6.85 minutes, favoring fewer but more immersive play experiences. Europe and North America follow closely with session lengths above 5.75 minutes, aligning with higher retention rates. Africa and Asia show shorter sessions, around 5 minutes, indicating a focus on quick bursts of gaming activity.
Session count
Africa and the Middle East report the highest session counts at 5.45 and 4.71 sessions/day, indicating frequent daily engagement despite shorter session lengths. Asia and Southeast Asia average lower counts, around 4 sessions/day, suggesting less frequent but steady play. Oceania and North America have the lowest counts (3.75 sessions/day), favoring fewer, more immersive sessions.
Genre performance
While this report aggregates data across all game genres to provide a comprehensive view of the mobile gaming landscape, this chapter focuses on genre-specific insights, breaking down key metrics by individual genres. Examining how games within a specific genre perform gives you a more granular understanding of trends, strengths, and opportunities.
This data helps you assess how your game stacks up against genre benchmarks, revealing areas where they excel or need improvement. For those in the ideation phase, understanding the performance of other genres can inspire decisions about gameplay mechanics, audience targeting, or monetization strategies. Additionally, you can make informed choices about market entry or diversification by identifying high-performing genres.
The metrics presented in this chapter represent the median 50% of games within each genre.
Insights
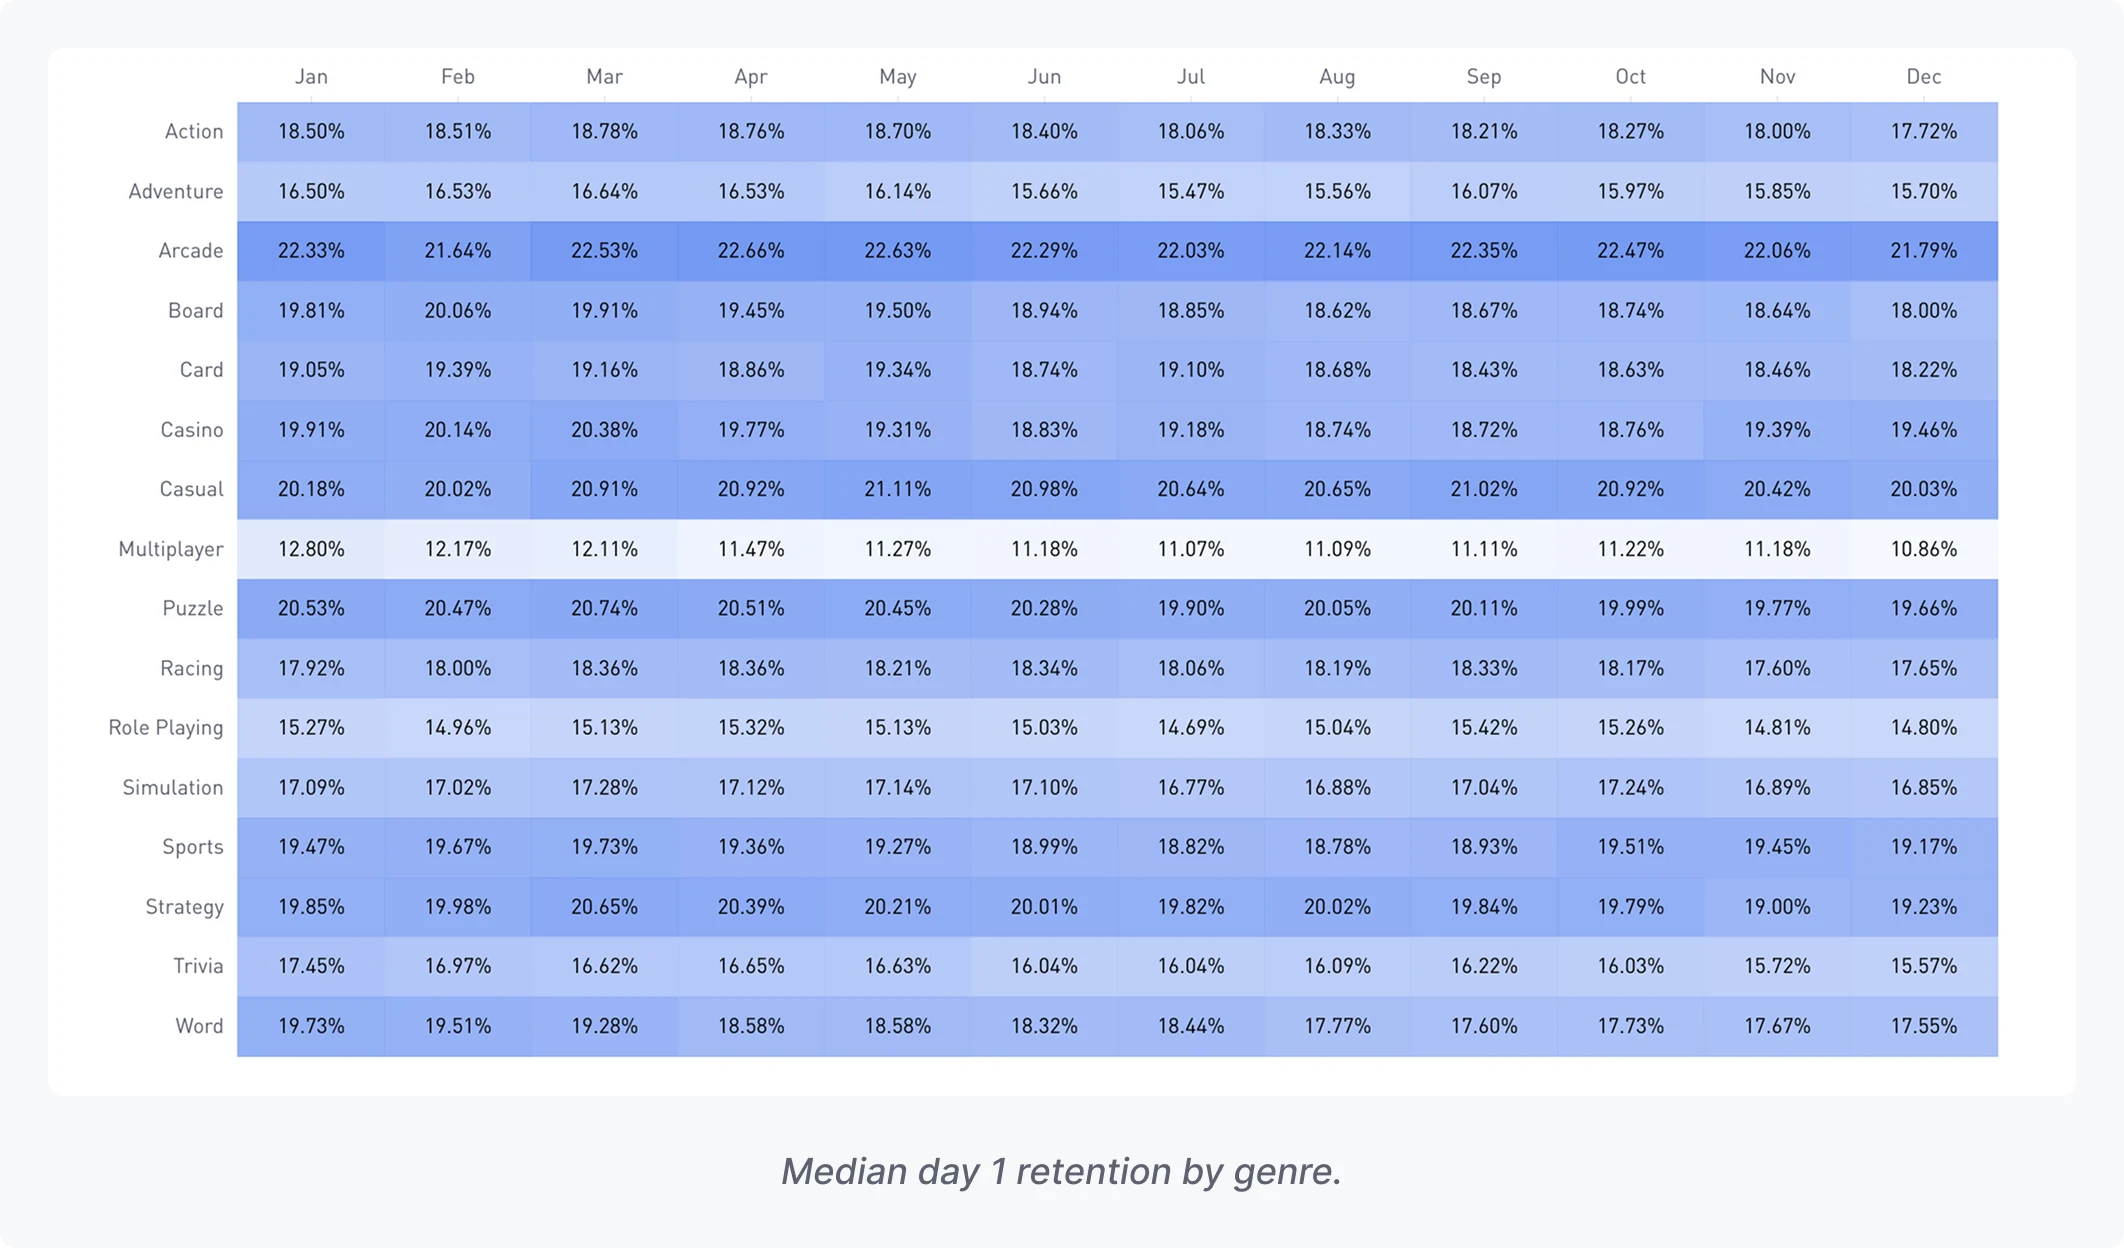
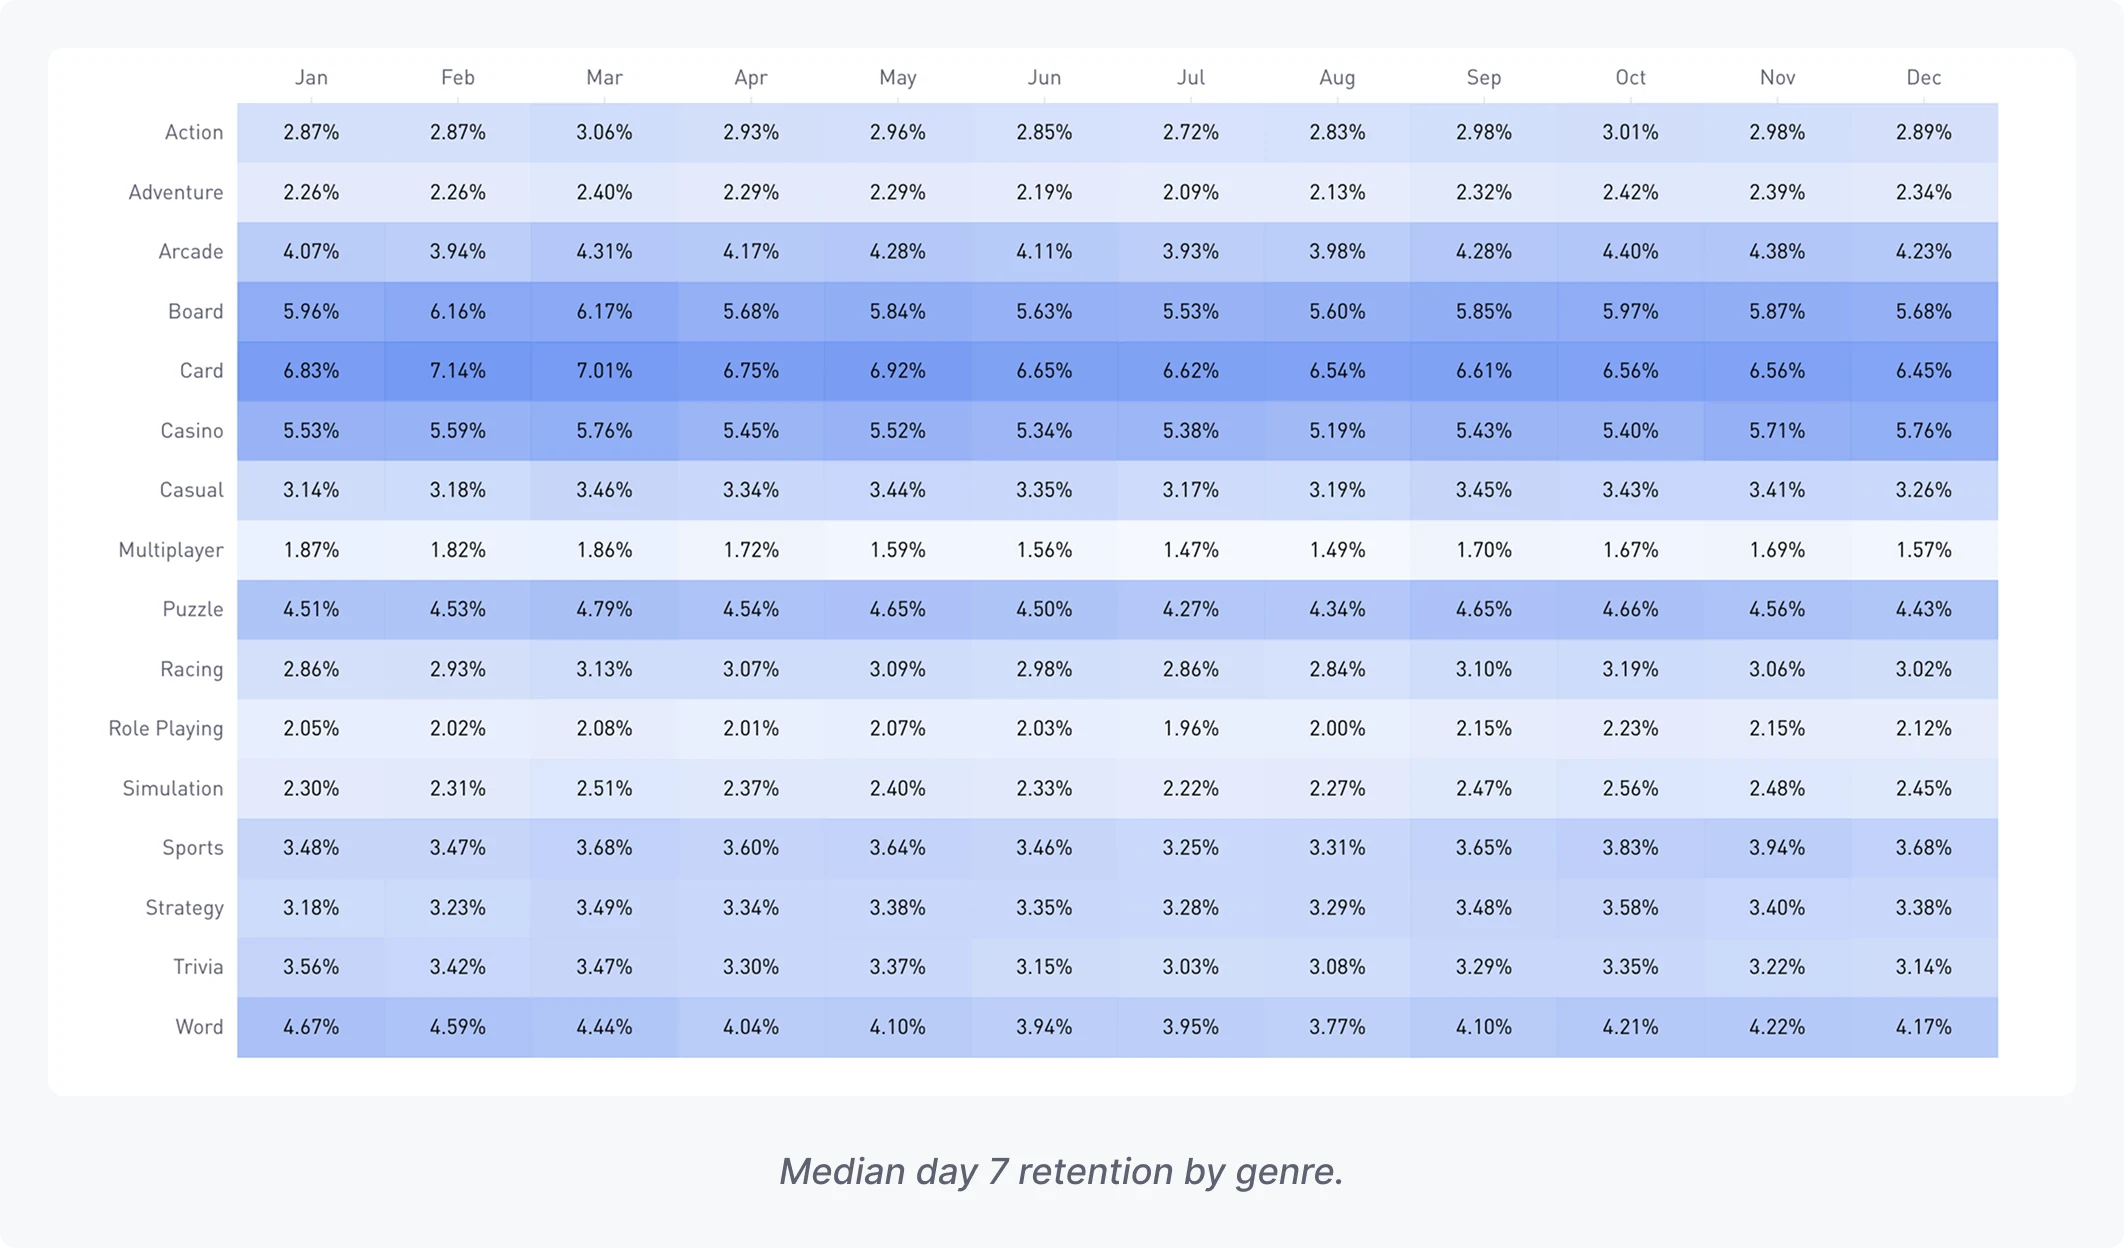
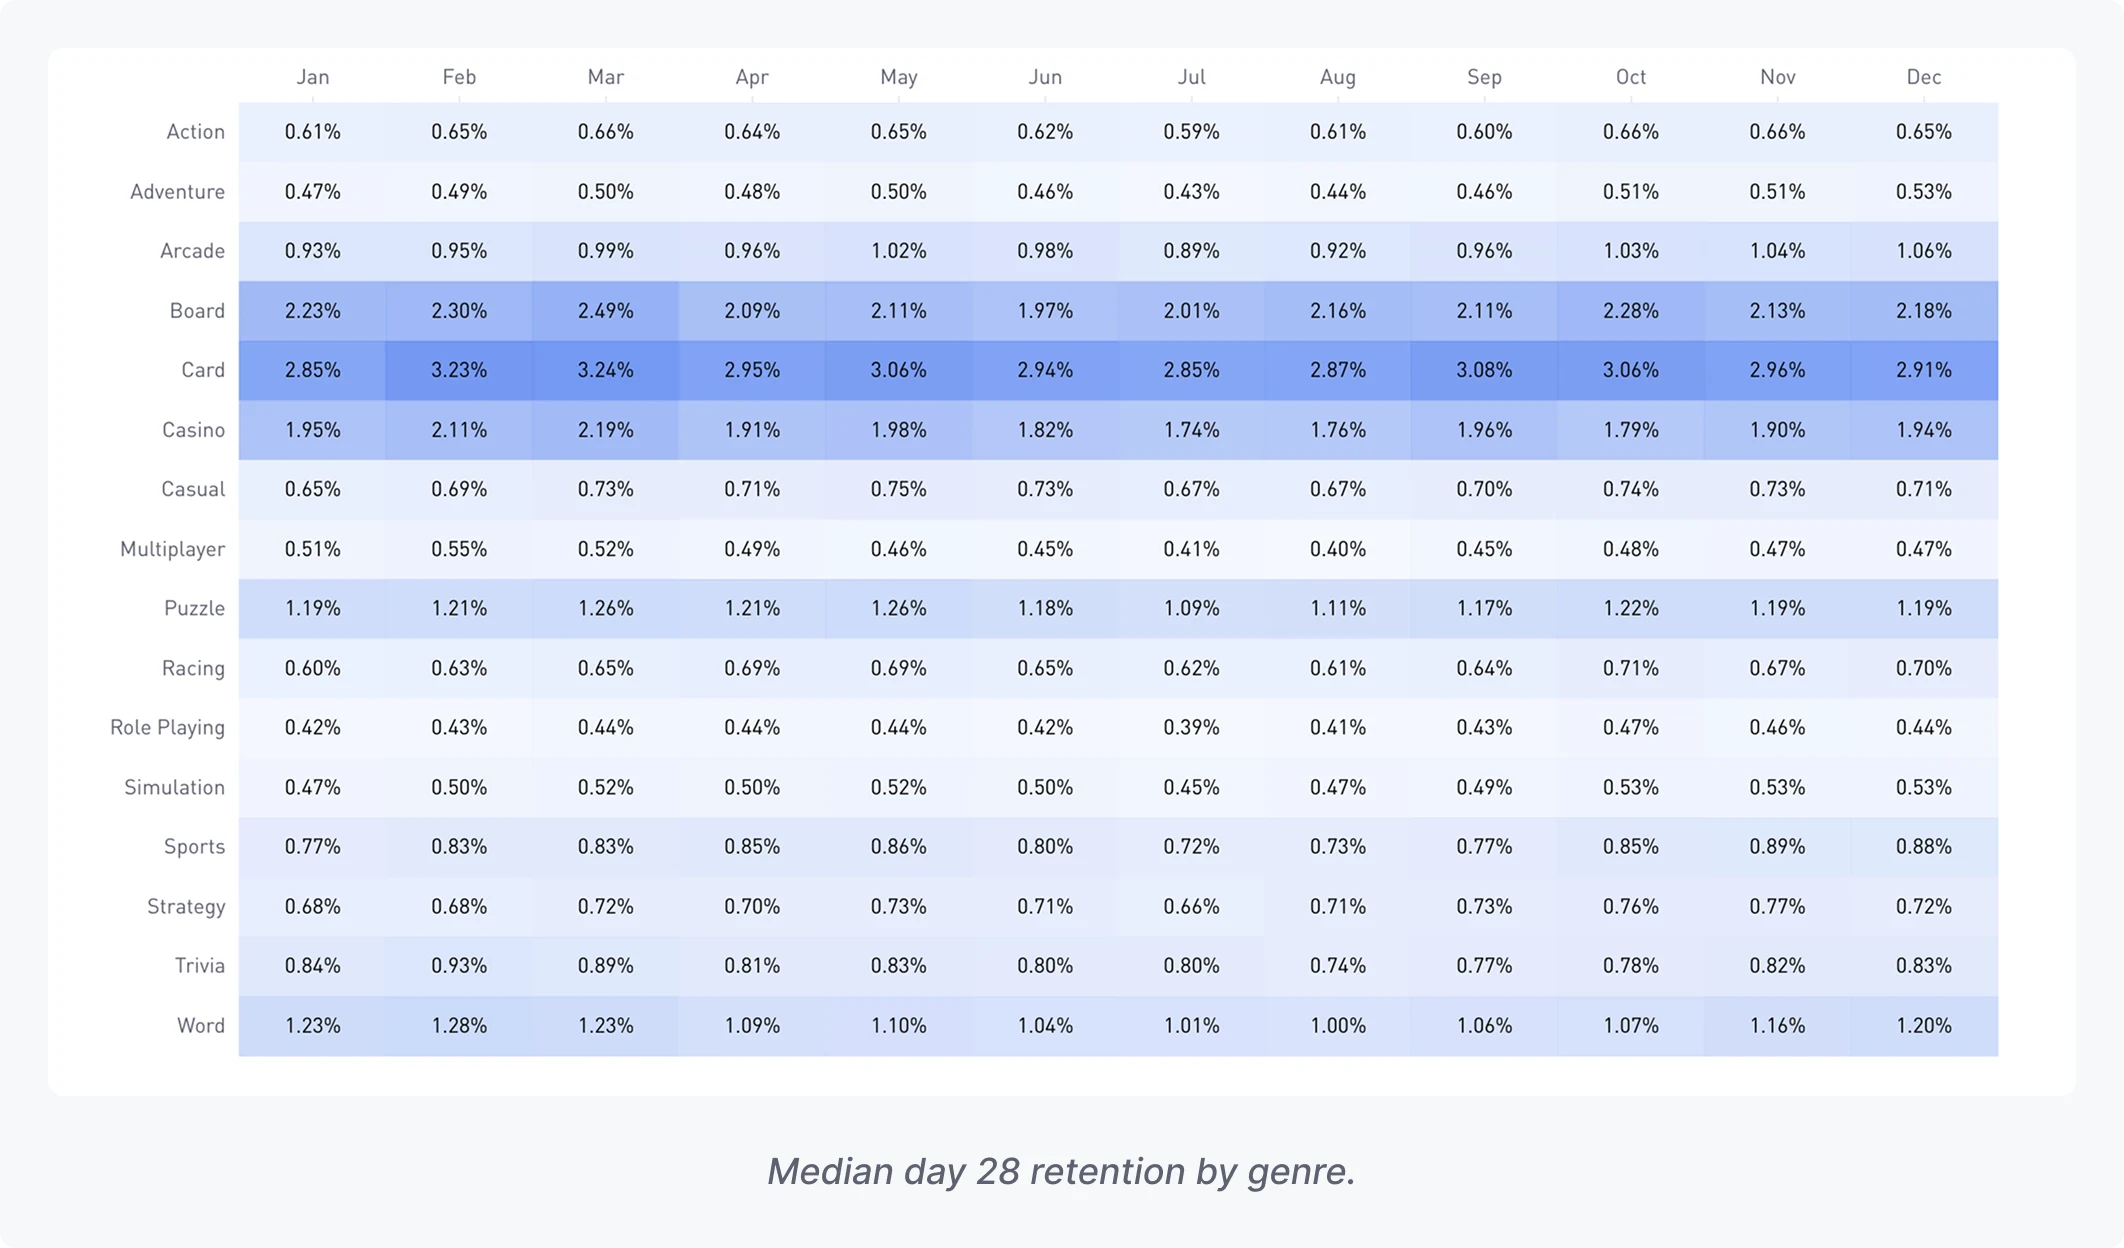
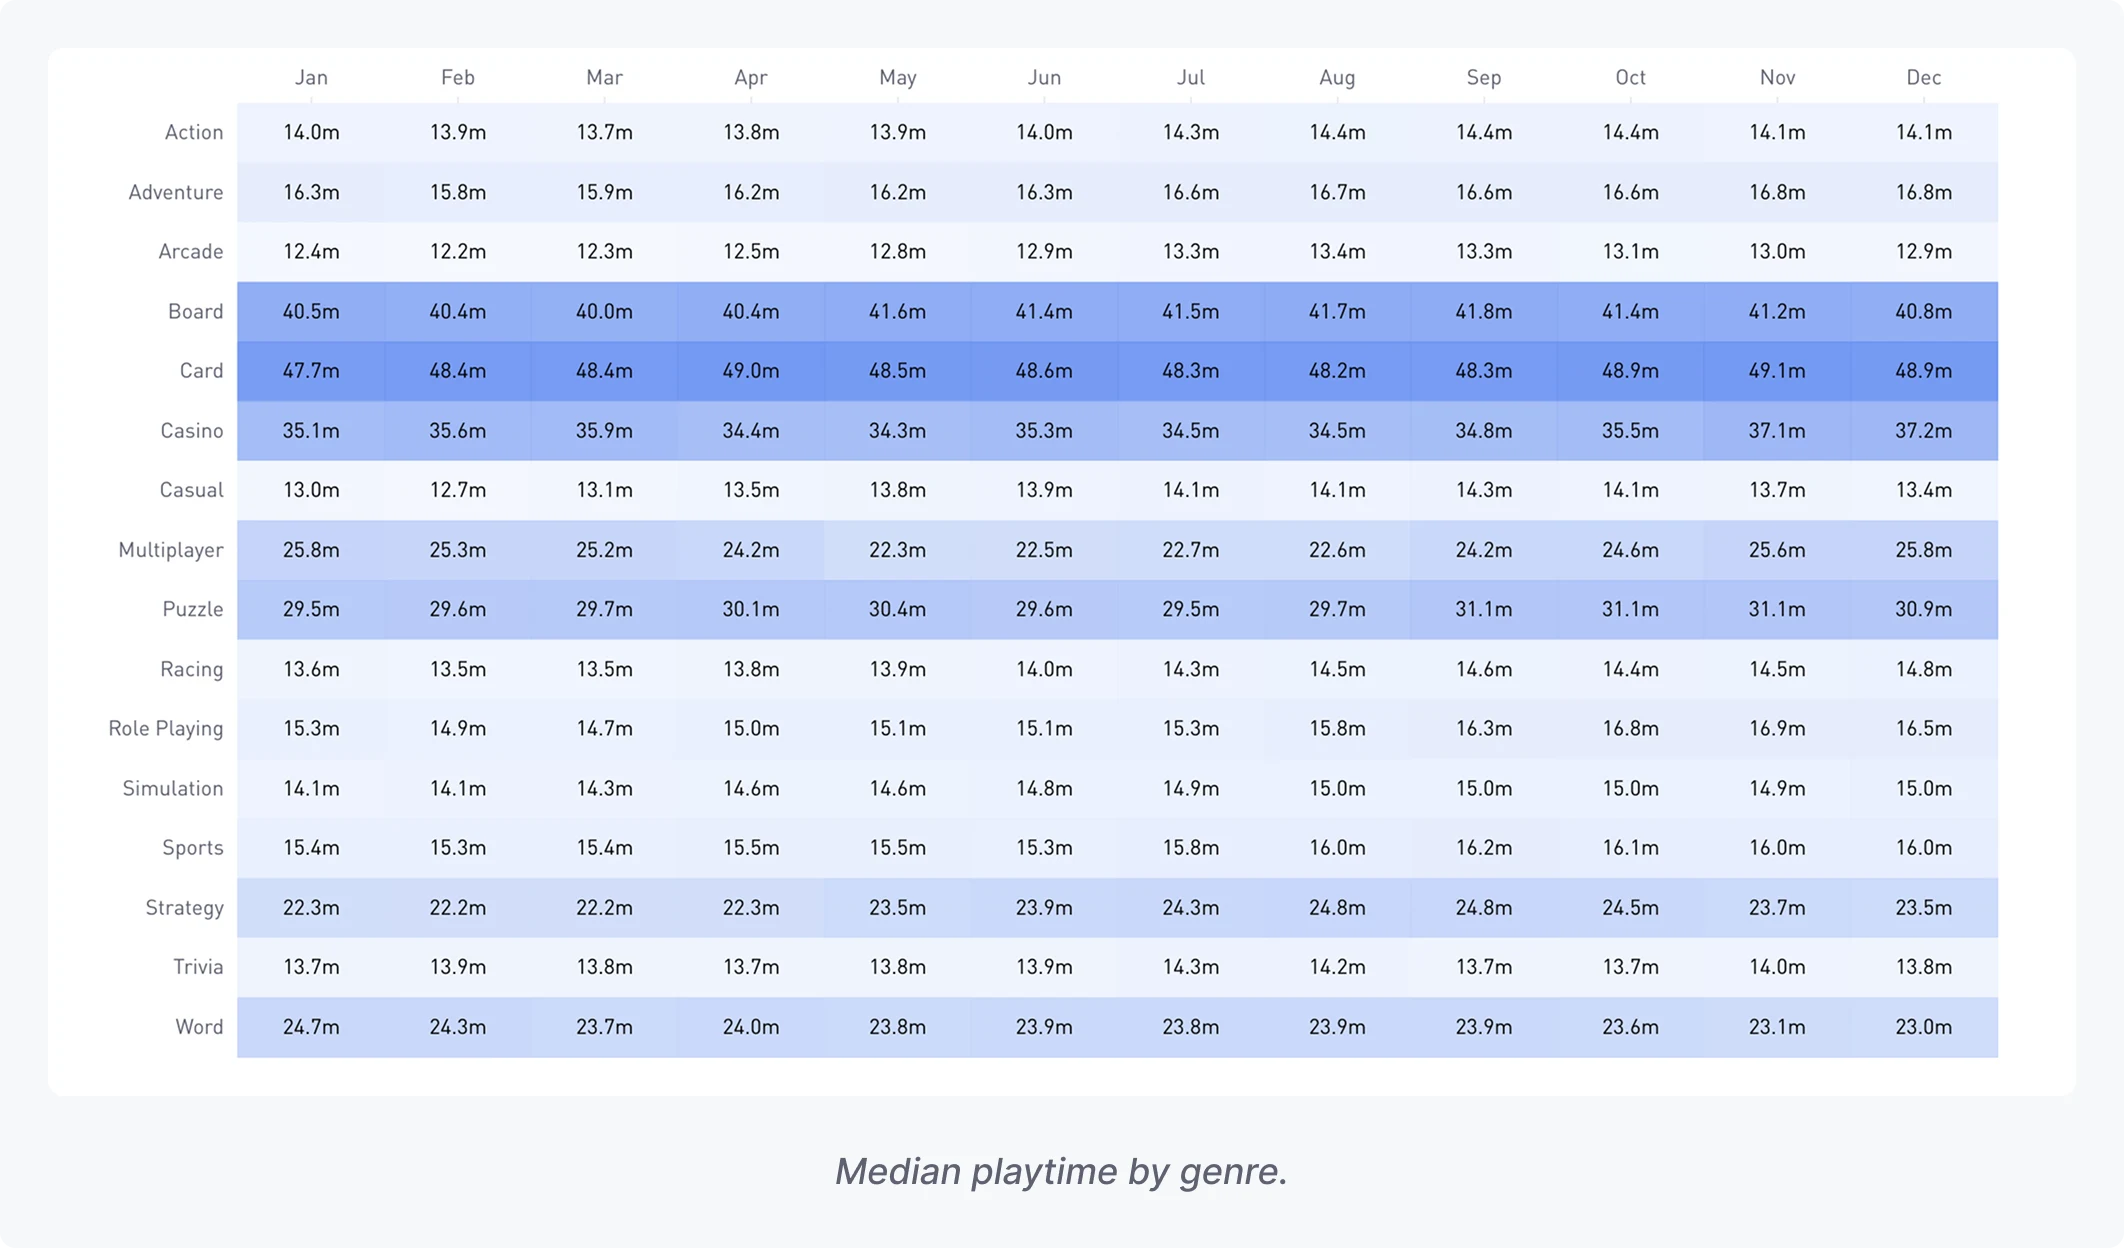
Retention-wise, most genres fall within the global benchmark ranges outlined earlier, but there are notable standouts. Arcade games shine with outstanding D1 retention, capturing players' attention early, but struggle to maintain engagement over the long term. On the other hand, genres like Board, Card, Puzzle, and Casino games show consistently strong retention rates across D1, D7, and D28, reflecting their ability to keep players engaged over time. These genres also excel in playtime and session counts, likely driven by their quick and rewarding progression loops that keep players returning frequently.
Multiplayer games, while delivering the longest session lengths, face challenges in retaining players, displaying the lowest retention rates overall. This disparity highlights the importance of balancing immersive gameplay with mechanics that encourage sustained engagement over time.
D1 retention
D7 retention
D28 retention
Playtime
Session length
Session count