Category
Data & Analytics

9 min read
#Data & Analytics
Top visualizations for game telemetry data
Imagine this. You come into work, load up your dashboard, and you’ve got a map of the world – each country a different colour. The greener the country, the more your game is making there. Visualizing your data can help you understand how your games are performing on an instinctive level. Numbers don’t often ‘click’ in our minds. But visuals – those give us gut feelings. They can help you see your data from a different perspective, and let you spot important insights you would have otherwise glossed over. But what can you do? Let’s dive into the top data visualization techniques and how to use them. 1. Line charts: Think time Line charts show us how values change over time. They’ll let you spot trends, like whether you have a lull in your installs on the weekends. Need to...

5 min read
#Data & Analytics
How TapNation makes hit games with DataSuite
TapNation helps nurture over 80 studios to develop hit games. Data is crucial when working on any genre. But particularly when you’re making a hypercasual game. TapNation helps studios all over the world to develop and improve their games. But to do that, they need accurate data. Fast. That’s where DataSuite comes in: it’s a collection of our services to help you bring all your data together and easily plug it into your other systems. We spoke with TapNation’s VP of engineering, Kamel Haddad, to see how that works. And what they use DataSuite for. Tell us a little about TapNation and yourself Sure thing. We are TapNation. We’re a publisher based in Paris and have taken around 80 different studios worldwide under our wing. Over the last few years, we’ve had around 19 hit titles, counting over 500 million...

#Case study
How TapNation uses DataSuite to increase the LTV of 19 hit games by 50% in only 6 months
Smashing obstacles with Giant Rush While they’ve seen huge improvements using DataSuite across their portfolio, one game stands out in particular: Giant Rush. (And not just because the character is huge.) The title has now reached over 140 million downloads. And, through a series of A/B tests and insights from the data they collected, they’ve been able to increase the LTV by a whopping 200% over six months for this specific title. “It’s because we A/B test every day,” Philippe Grazina from TapNation says. “We ask questions like: When are players leaving the game? For example, the boss in Giant Rush. If we spot that they’re leaving at the same point every time, we know we need to make a change. Small details like that really help.” Through these granular insights, TapNation can iterate and improve on their game step...

9 min read
#ASO
“Squid Game” Mobile Games: Who Made It Into The Charts?
Squid Game games turns Mobile Netflix released the new show, Squid Game, on September 17th 2021. Over 132 million people watched the show in the first 23 days of its release, with 4.4 million new people subscribing to the platform (presumably to see the series). It’s easily a new record for Netflix, overtaking Bridgertons number 1 spot. Netflix have even announced that they’re going to make their own “Squid Game” game, as an attempt to increase its popularity in regions like North America. Netflix aren’t the only ones reaping the benefits of this Korean Battle Royale style show. We’re being flooded with memes, halloween costumes, and merch around the hit, all across the globe. But more importantly, mobile games. We’ve seen hundreds of hyper-casual games enter the app stores, all inspired by the Squid Game theme. With the topic still...

7 min read
#Data & Analytics
iOS 14 Opt-in-Rate Is Higher for Mobile Games
Earlier this year, Apple released iOS 14.5. It was the dreaded update among all app developers, studios, and publishers. If you wanted to access a user’s mobile identifier (IDFA), you had to ask for their consent specifically. If you’re unsure why this is important, the IDFA is used for advertising purposes. When Apple released the update, almost every user needed to opt-in (rather than out), hugely impacting advertising and ad revenue. (More about this here.) But we’ve seen some interesting findings about mobile game opt-in rate. Which is what we’re going to cover in this blog. We have data on Opt-in Rates We’ve read tons of articles and blogs within the industry over the past few months. All speculating what they think the Consent Opt-in Rate would be – especially for games. And for us, we don’t need to guess...

#Case study
How Wargaming uses GameIntel to focus on successful game ideas
They could focus their efforts When testing out concepts, it’s difficult to know which ideas will be successful and which will be a waste of effort. In the past, Wargaming’s data didn’t give them quite what they needed and wasn’t particularly scalable. It also didn’t feel fair to their studios. With GameIntel, specifically metric data from Benchmarks+, they could create realistic targets for studios to reach and base their decisions off the data. They now know what KPIs are considered good, great, and downright poor in the industry for each key sub-genre, rather than just guessing. “Success isn’t always about releasing a game. It’s sometimes about shutting a game down soon enough so that you don’t waste time and money,” said Alex Nenadavets, their manager of competitive intelligence. “We’ve definitely saved time by not wasting it on ideas that wouldn’t...

5 min read
#Data & Analytics
The Metrics Behind Hyper-Casual Games (Industry Report)
We’ve been getting our research on, and looking into the metrics behind successful hyper-casual games. You can read our full findings here. But just in case you’re too busy for that, we’ve put together this post to give you the need-to-knows. What’s the research about? Using data from our network of games, we’ve broken down the top KPIs (key performance indicators – basically measurements of performance) that developers of hyper-casual games should be aiming for, by sub-genre. You can use these to benchmark your own games against some of the best games, and learn just whereabouts you sit within the industry. But before we do, here’s an idea of how much data we’re handling in GameIntel. Our network stats for Benchmarks+ All-time integrated games: 140k+ Games tagged with sub-genres: 150K+ Cross-title monthly players: 2b+ Average monthly sessions: 20b+ Network stats...
1 min read
#Data & Analytics
Sub-Genre Snapshot: Hyper-Casual Games
We break down the top KPIs that Hyper-Casual developers should be aiming for, and reveal a few of the rising superstars that entered the market in 2020.

4 min read
#Ads & Monetization
CPI or CTR? How to Best Measure Your Game’s Marketability
Editor’s note: This article was originally published by Sara De Vries, Content Creator at Coda. You can find the original article here. When it comes to understanding the potential success of your prototype, market testing is the best way to accurately measure a user’s reception to your game. Most rapid market testing is conducted on social media platforms such as Instagram and Facebook, as they allow you to test the marketability of your game in both an economic and efficient way. The types of campaigns or tests on these platforms can range from tracking traffic to engagement, and from them you can calculate important KPIs such as Click-through-rate (CTR) and Cost-per-install (CPI). A CPI or a CTR test are two different types of tests and both have pros and cons worth considering for your particular stage of development. Keep reading...
5 min read
#Data & Analytics
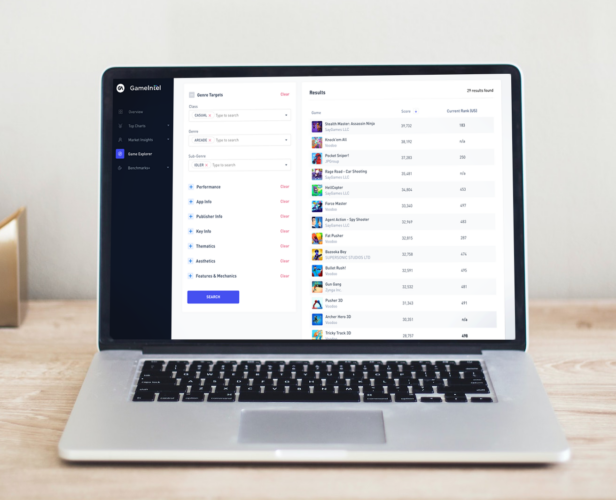
How to Get the Most Out of GameIntel
We’ve just launched our new mobile intelligence platform, GameIntel. With it, you can follow market trends, see which games have the best performance indicators, and supercharge your game research and ideation. But what exactly can you do with GameIntel? Well, how long is a piece of string? It really depends on what you’re looking for and what questions you need answering. But to get your creative juices flowing, and give you an inside look to our new platform, here are a few things to get you started. 1. Be the first to know about breakout hits Nice and easy one to kick us off. You can track the top charts in real-time, around the world. Free or paid. Updated hourly. You’ll get all the key information you need about these hit games. All of the key info about each game...

5 min read
#Data & Analytics
How to Improve Your Game KPIs and Boost Revenue – Lessons From Bubble Sort
Editor’s note: This article was originally published by Kinsey Dardanus, publishing expert at TapNation. You can find their version here. Bubble Sort is a worldwide leading puzzle-game, on both Android and iOS, totaling more than 15 million players across the world. We originally launched this game on December 19th 2019, and since then we’ve been at the top for a whole month. But what’s the secret sauce behind this game’s success? The short answer: deep player behavior analysis, and lots of level difficulty improvements. But there’s much more to it than just that. At TapNation, our data scientists and engineers have developed tools and algorithms to monitor, analyze and test our gameplay and difficulty curves in order to improve our KPIs. And in this blog, we’ll give you a sneak peek behind the curtain, and share some of the techniques...

5 min read
#Data & Analytics
Making Better Game Decisions with Feedback Testing
You might be familiar with the concept of split testing. Also known as A/B testing, split testing compares different versions of your assets to see how each performs with your players. At the conclusion of your test, you adopt the variant that showed the best response. Split testing is a critical part of the game development process. It’s pretty much baked into any user acquisition campaign, with ad creatives and app store assets quick and easy to A/B test. But a traditional split test’s quantitative data can only tell you so much. And this kind of testing is only possible once the game is up and running. That’s why feedback testing is so important. It provides qualitative data to show you the why behind what is and isn’t working. What is feedback testing? Feedback testing is essentially surveying players to...

3 min read
#Data & Analytics
Top UA Tips for Testing New Hyper-Casual Games
When you’re developing a hyper-casual game, it’s not enough to just publish it and hope it takes off. You need to do extensive, iterative testing to get an indication of the best possible UA performance as well as in-game metrics. So where to start? Here are our top tips for maxing out your metrics: Know what you’re testing for and what KPIs you’re looking at Vague testing methods will only get you vague results. The first thing to decide on is what the purpose of your test is. Are you running a marketability test? Exploring a game concept? Or are you testing creatives? Once you’ve decided what question you’re trying to answer, be clear on what KPIs you’re going to measure with. Is it the CPI? IPM? CTR? Retention? You need to know all of these before you start testing....