· 4 min read
ARPPU in top performing games up 20% compared to 2016

Analysis from Benchmarks+ takes into account several different performance quantiles, including the “superstars” (top 5%, 10%, 15%), and the “standard” quantiles (top 25%, median, bottom 25%). We’ve segmented the analysis in this way to give a broad signal of typical performance bands seen across the industry. Tracking these quantiles also sheds light on historical trends per “band” to give a better sense of how the industry has evolved.
Using Benchmarks+, we have analyzed how the main gaming categories and genres have performed for daily ARPPU (Average Revenue Per Paying User), looking at the full year of 2019, and all the way back to 2016. For this analysis, our key focus is the top 5% performance for this metric, which is a good indication of how much “whales” spend in popular titles on any given day. All revenue is IAP based and daily ARPPU values are averaged to weekly data points.
Daily ARPPU has increased by around 20% since 2016
The top 5% of daily ARPPU values across all genres has climbed to around $66 (roughly an $11 or 20% increase compared to 2016). Despite this growth, the top 25%, median, and bottom performers have remained the same. This essentially means that players are prepared to spend more than ever before in the games that really capture their attention.
Even at the top, there is a huge variance: the gap between the top 5% and the top 10% is almost 2x. What this means is that the best performing (top 5%) of titles can on any given day see a daily ARPPU as high as $70, double the ARPPU of games in the top 10% at around $35-40.
But what does spending look like for each gaming category?
Benchmarks+ allows users to filter top metrics by the different App Store genres, with these genres grouped into three main categories of mobile games. For this analysis, GameAnalytics has reviewed ARPPU for the Casual, Classic, and Mid-Core categories, sharing how this trend varies across different game types. Benchmarks+ will soon launch more granular sub-genres.
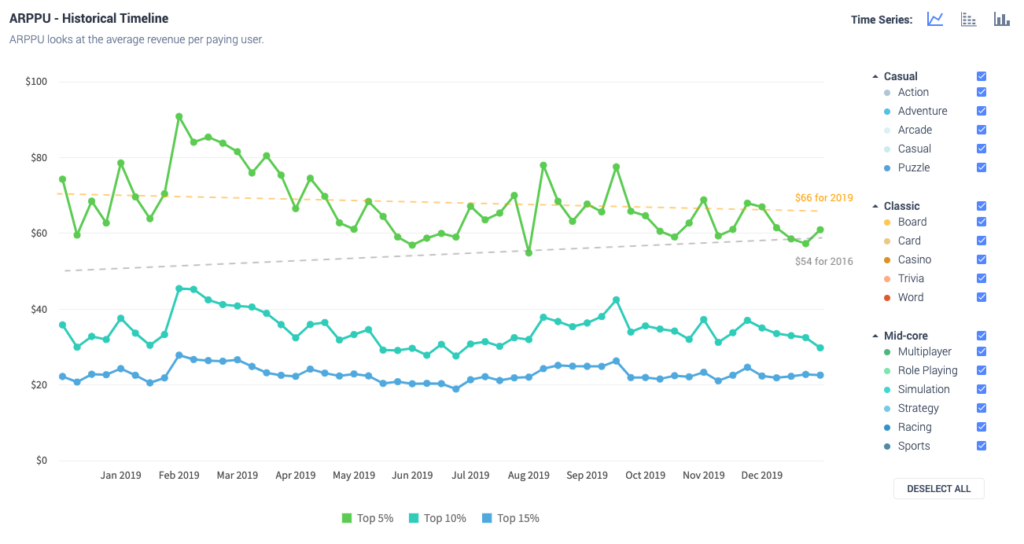
ARPPU for top-performing “Casual” games is around $50-60
Between H2 – 2018 and H1 – 2019 the ARPPU for top-performing Casual games was at an all-time high. We believe this was a result of the hyper-casual boom and the sheer number of players this genre was bringing in. In the latter half of 2019, this metric began to show signs of stabilizing more towards the “normal” levels of previous years. This could be a reflection of an ever more ad-focused approach, but also of the increased competition in the casual space.
Daily ARPPU in “Classic” games has increased by 35%
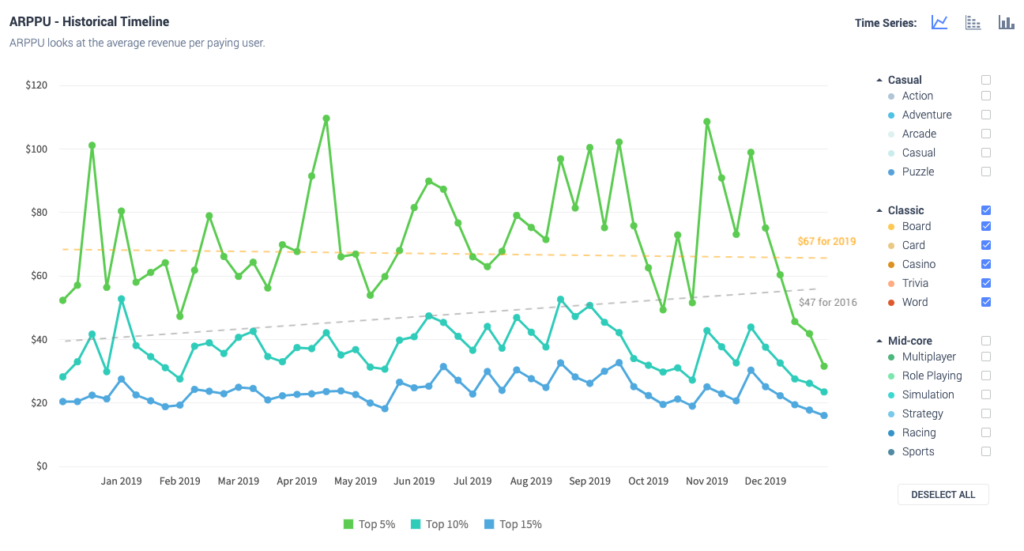
Throughout 2019, the best performing Classic games consistently achieved a daily ARPPU of $60 upwards. This is an increase of $20-30 compared to 2016. The top 10% has increased by up to $10, and the top 15% increased by $5. This means high spenders are parting with more cash in the classic titles, across a larger range of games. These types of games (word puzzlers, solitaire, chess etc.) are popular across all age groups and demographics, including older players with more disposable income, which might account for the increased spending.
Daily ARPPU in the best “Mid-core” games is around $50-60
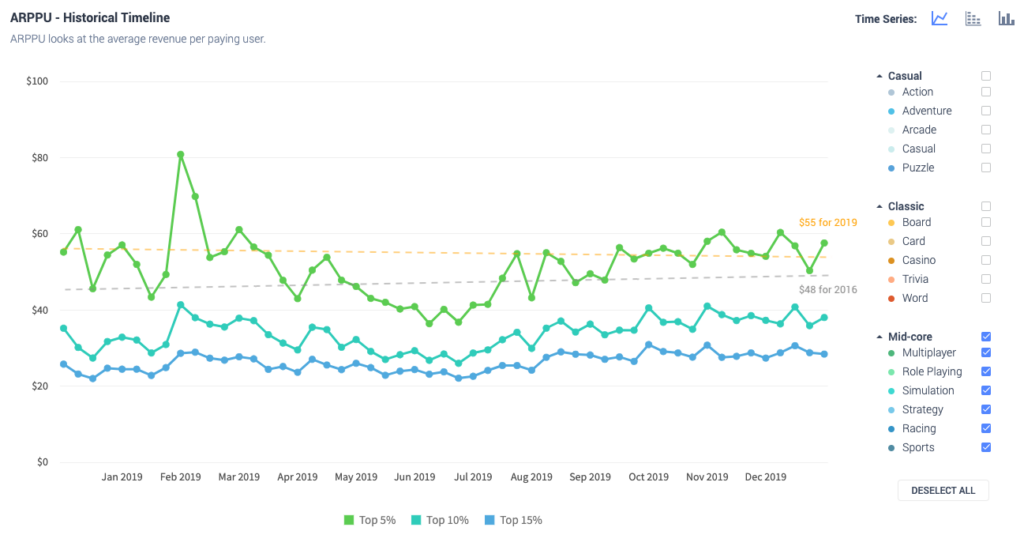
Although the quantile variance is less pronounced than it is for the other categories covered, the top performing 5% of mid-core games still see up to 3x better monetization than the top 25%. Overall, the closeness of these performance quantiles highlights that mid-core games are better at converting across the board, with an overall greater focus on IAP still, even in this age of ads. Since 2016, the top 5% ARPPU has increased slightly, by about $5-10.
In summary
It’s evident that the market is now undergoing widespread changes at a quicker rate than ever before. Hyper-casual appears to have boomed, and now might be evolving into something quite different. Although this analysis shows there are similarities between the different gaming categories, the need to follow industry trends per genre has never been so high, especially if developers want to truly succeed in this ever-evolving market.
At the moment, users of Benchmarks+ are able to answer these questions and more, filtering by category and genre for the major quantiles, all the way back to 2016. We will soon release advanced filtering options, allowing users to drill down across different geographies, operating platforms, sub-genres, and even filter data by IAP spenders. This release is planned for late January 2020.
You can find more information about it here.