· 14 min read
How To Build Killer Dashboards In Game Analytics

Think about how many times you visit your analytics dashboard on any given day. Then, think about how many times you send and reference analytics. You’re probably not only spending many hours in your analytics in any given week, but you’re possibly also relying on those dashboards and the reports they generate for key insights into your audience, and potentially even investor or C-Suite buy-in. After all, telling a story with your analytics reports is invaluable!
Therefore, the creation and curation of those dashboards is incredibly important. In fact, making the choice about what to feature and highlight on each dashboard should be one of the most well-thought-out decision processes that you can engage in as a game developer.
After all, analytics are at the heart of your game’s success itself, so they should be crafted carefully in order to set yourself and your team up for success in the future. Which is why crafting your dashboards wisely can be one of the most valuable investments of time that you’ll ever make as a game developer.
Finding The Canaries In Your Game’s Coal Mine
So, how do you decide what to track, and what is the break-out between daily reporting, monthly or quarterly reporting? It starts with determining what matters most, as well as determining which KPIs are the “canary in the coal mine” – or the sentinel species – of your particular game; the ones that indicate potential issues before they become major problems.
As a result, finding your canaries is important! Determining which ones are the most impactful can become trial and error, but there are some key KPIs that you should be tracking daily.
There are some common KPIs that tend to be the “canaries” for most games, tracked across the board, such as the number of players who log on and play per day, the number of daily new customer acquisitions, session length and engagement time, first monetisation, and more. However, as you delve more into your game’s analytics and reporting throughout the course of its lifespan, you’ll recognise the particular KPIs that are its unique indicators.
Accordingly, it’s important to start with these common KPIs and metrics represented in your daily, weekly, and monthly dashboard views in order to properly monitor and track things – and to keep an eye on your “canaries”/key indicating metrics.
So What Canaries Should You Monitor And Which KPIs Should You Track Daily?
While these are different for every game and development team, there are definitely some commonalities in the gaming world, as we discussed in the essential metrics that all game developers should know. For instance, the number of players logged in per day, their session length, and new sign ups all matter significantly, but there’s plenty more to pay attention to.
The first metric mentioned- the number of players logged in per day – may matter the most. Even if you are regularly acquiring new players, keeping the ones who have already downloaded, installed, and invested time in your game is essential to its overall community health.
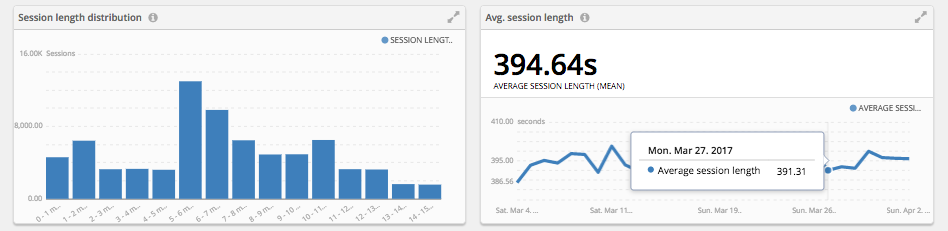
The session length is also pretty significant, especially if it changes significantly. For instance, you probably are aware of the average amount of time your users spend playing your game in a given day, week, or month, but you’ll want to keep an eye on whether that is shifting upwards or downwards drastically. In fact, drastic changes can often indicate bugs, or be a sign that a certain level or challenge is too complex or too simple, especially when combined with other user behaviour data. Changes in session length also speak to the engagement level of your users; users who are more engaged tend to spend more time in-game.
Tracking the amount and rate of first monetisers – the first time when a user first spends actual money on the game via in-game purchases – is also an excellent idea for all kinds of games. For free-to-play games the reason to track and monitor the rate and location of first time monetisations is all-important, as it is to track when users upgrade or spend more money in games with an upfront fee as well. Plus tracking when and where your users engage with ads, if they do, is essential! This could even be considered a different kind of first monetisation as well.
Next up is tracking your user’s progression throughout the game, while how they use resources can also be quite valuable. Seeing where your users are in the game landscape, as well as what level they’re on can help you to make sure you have a healthy community mix of beginners, intermediates, and experts. As an added bonus, you can see where users might be getting stuck and make tweaks to the game play architecture accordingly.
With this in mind, how do you decide what KPIs to track on your daily dashboards? The above list is a pretty good start, but you should also tailor things to your individual game as well as its idiosyncrasies and quirks, and even your own! We all have particular KPIs that we find more useful or insightful than others for whatever reason, so customising your game analytics dashboards can be a very personal thing.
Recommended Dashboard Inclusions
Once you’re ready to build out your dashboard, you’ll need to refine and narrow down on what stats, KPIs, and metrics you want to track. While you’d probably like to include everything under the sun, think about what you and your audience really need to look at on a daily, weekly, or monthly basis, as well as who you are trying to impress. Will the c-suite be looking at this? Investors? Your marketing team? The developer(s)? Just you? Or some combination of the above?
Answer the question of “who” will be using the dashboard and you’ll be able to be more accurately able to figure out what metrics or KPIs to include in your customized daily, weekly, and monthly reports.
Real Time Stats
Your daily dashboard should definitely have real time stats, even if it does tempt you to check in way too often (developers, marketers, and managers, you know who you are in regard to the too-constant analytics reviews). Despite the temptation to stare at the dashboard and watch the data roll in, being able to monitor your users’ activity in real time is too valuable to totally resist it or hide the stats for.
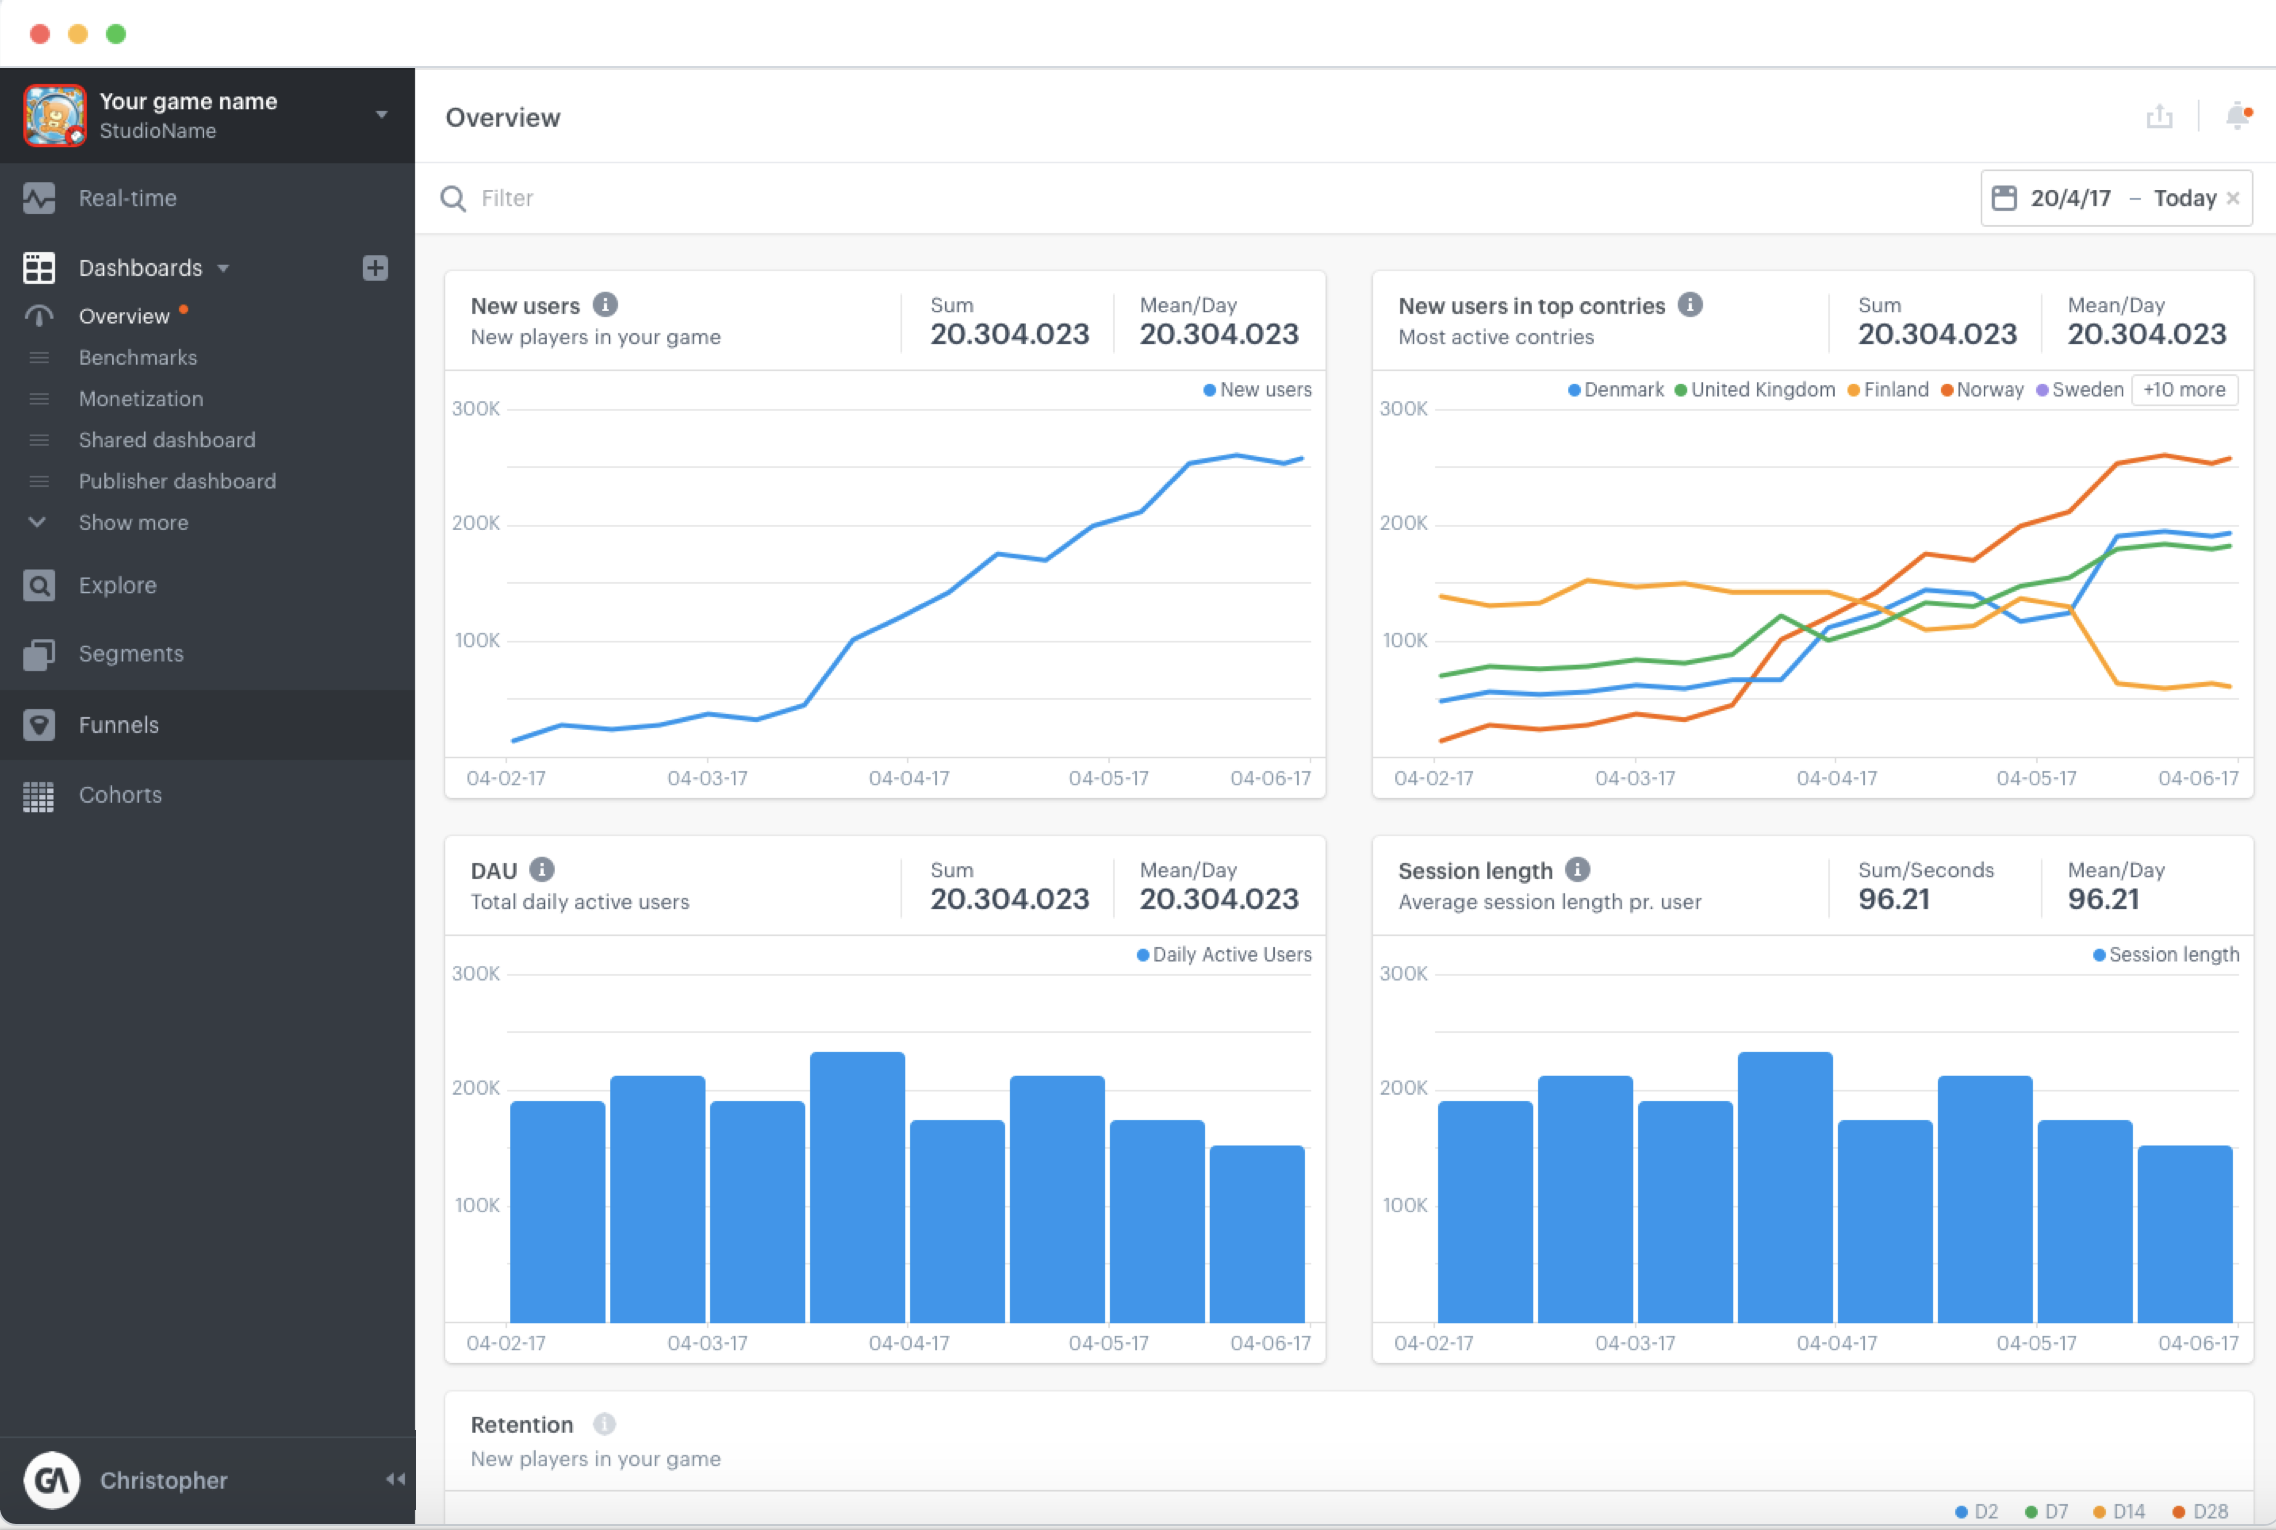
Overviews
All of the statistics and KPIs mentioned above that we described as the canaries or sentinels? They should be in your everyday overview, or the main dashboard that you look at on a daily basis. Deciding on the layout of this dashboard is uniquely personal, however, and it might make sense to mimic a more standard analytics dashboard (for example, Google) that everyone knows and loves at first.
User Acquisition And FTUE (First Time User Experience)
Tracking the rate and sources of user acquisition is another key metric; ideally it should be tied to marketing activities as well as referral sources, but it’s important to track on a broad basis overall. Having one slot or module on the daily dashboard for the daily rates is useful, and you can always go more in-depth as far as sources, location, and more.
On the contrary, tracking user acquisition by source on a daily basis could be incredibly valuable during a marketing push or similar activity; there’s nothing like seeing and tracking a real time impact on your game to help refine your efforts.
In addition, you’ll want to track a player’s progression through the game starting from the very beginning – their first time user experience, or FTUE. Being able to set up the steps (and add and subtract new ones as your game evolves, like you can in the GameAnalytics platform) and monitor your players’ progress is especially important for developers and anyone else involved in the nitty-gritty day-to-day process of running a game.
User Retention
Once you’ve acquired the users, you need to keep them around! Tracking your user retention rates and keeping an eye on any trends or changes is essential in order to mitigate any potential issues before they blow up.
What’s more, you should track retention over time. One common method is to track day one, day seven, and day thirty retention rates; after all, the first day of user retention is important, but one-day-only users don’t tend to spend tons of cash, so tracking and monitoring player retention over longer terms is essential. You can also connect player retention rates with how long your game takes to play through (if applicable), so monitoring that connection and associated trends can be invaluable in your weekly and monthly dashboards.
You may also want to combine user retention – in the sense of the number of days since the game was installed – with progression through the game, so you can see how quickly the users play through and experience your game, make sure they aren’t experiencing any roadblocks, bottle necks, or other difficulties as they play through the game.
Engagement
The amount of time your players spend engaging with your game is of utmost important in general; this applies to average session length, player churn, and more. After all, if you don’t have players engaging with your game, the rest of these KPIs and metrics are a moot point.
For instance, looking at daily active users versus monthly active users can be quite illuminating. In addition, looking at other churn rates over a given day, week, or month is important. Knowing the churn rate of your game and watching fluctuations like a hawk – and then exploring and discerning the source of said fluctuations – is essential to building a healthy community.
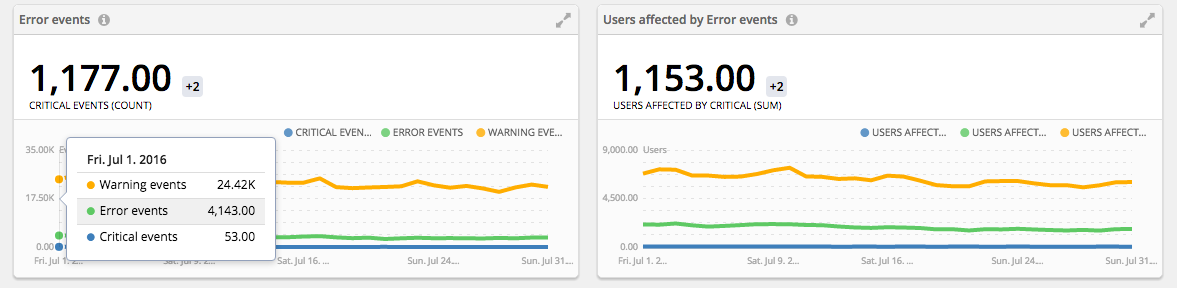
Error Events
You’ll want to track a variety of events as part of your game’s progression, but the number of times an error message was triggered and the number of users affected is particularly important, since it indicates potential game performance issues.
First Monetisers
Noting where a user first becomes a source of cash is pretty valuable (so you can ideally create more of these positive behaviours), along with keeping track of first time user experience or a player’s progress through the first few minutes of their very first session after downloading and installing the game. This is nearly as important to track as new user acquisitions, since getting the users to make you money is almost more important than acquiring them in the first place.
First monetisation can also apply to users who click on or even view their first ad as well as users who make an in-game purchase; this metric should be tracked across the board regardless of what type of game or monetisation style you might be working with.
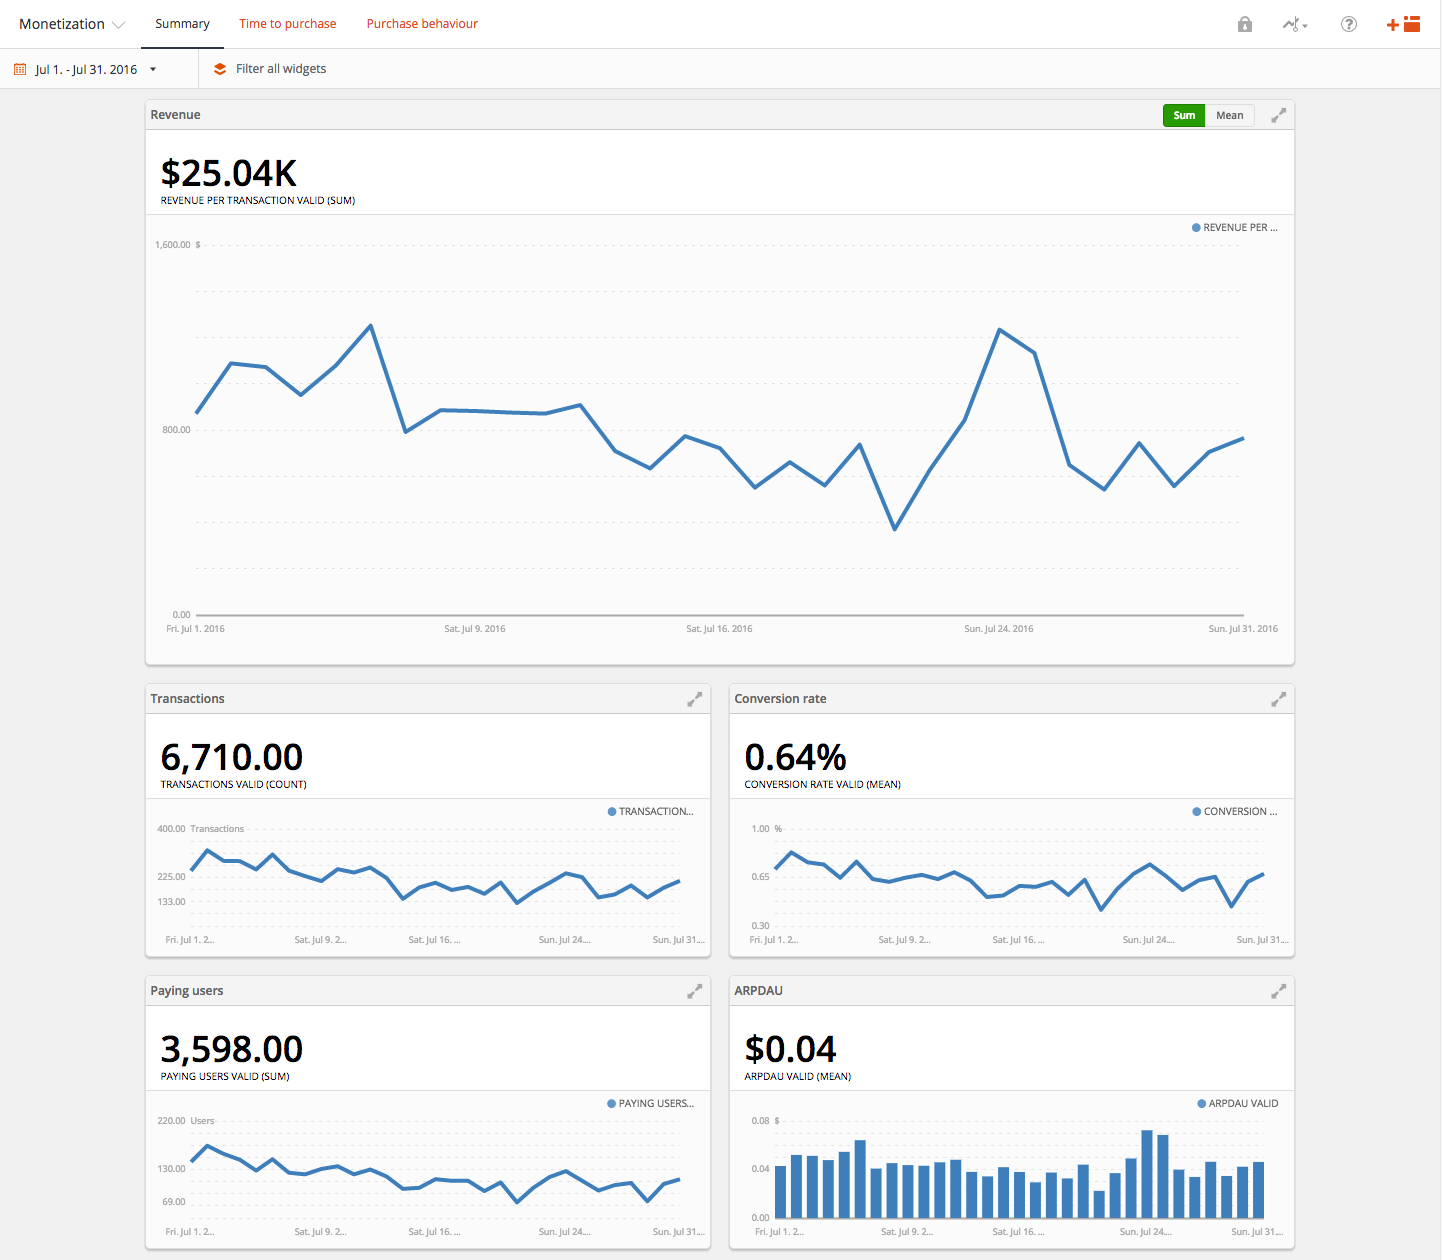
Monetisation
Tracking your monetisation is also essential, and for many profit-focused game devs these metrics might be the group of KPIs that you look at the most often.
The first instance of monetisation, ARPDAU or average revenue per daily active user, ADRPPU (average revenue [average daily revenue per paying user) combined with first time monetisation data can be quite revealing. In fact, tracking and monitoring these KPIs will help you measure return on investment (ROI) and make relatively accurate earnings forecasts, making this perhaps the most important metric in your dashboard.
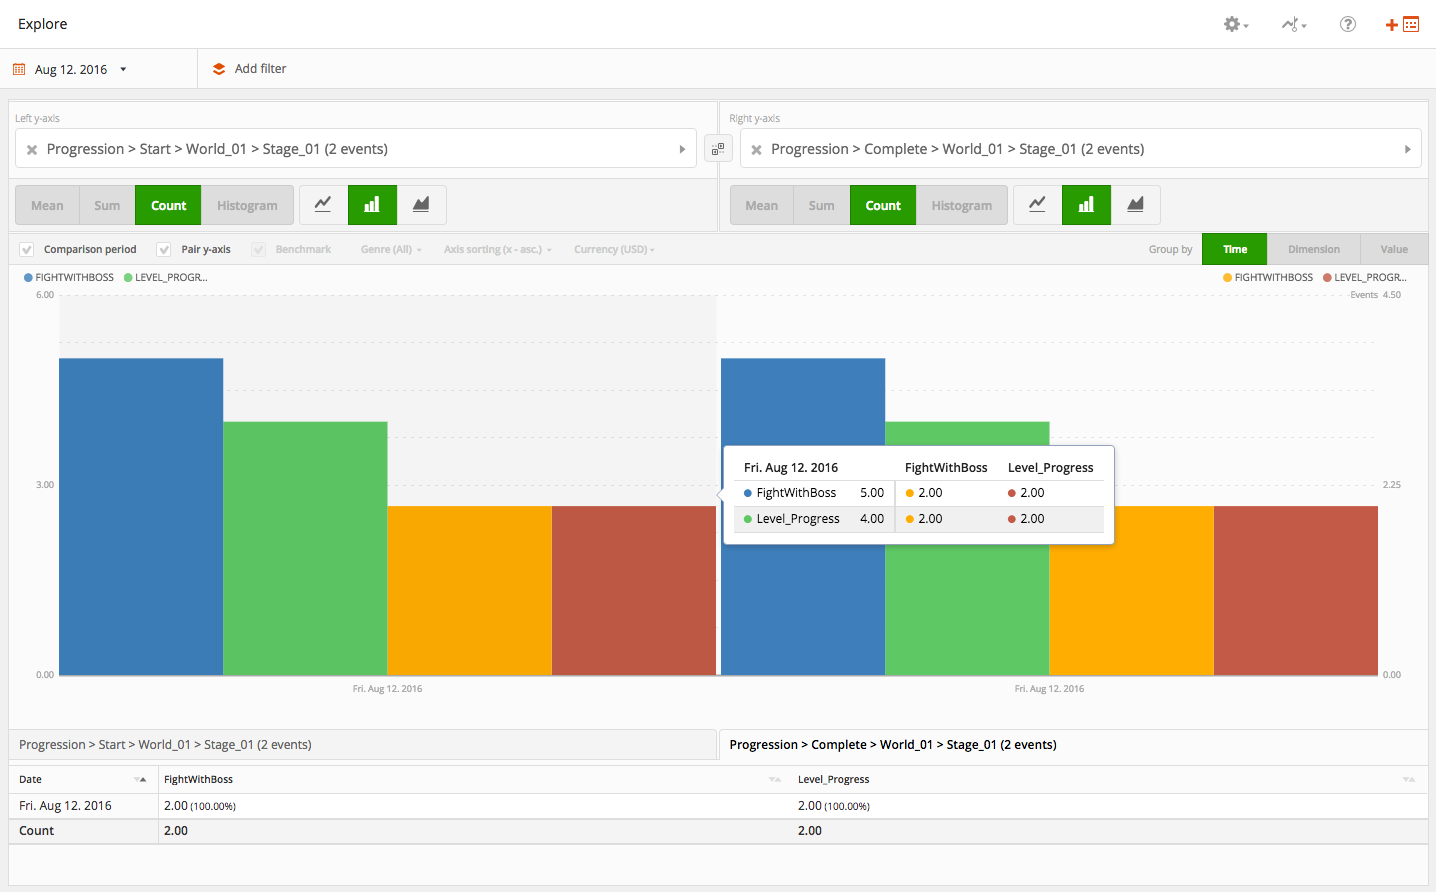
Progression
Tracking your users’ progress through the game on a regular basis is helpful for making sure you have a healthy and varied community of beginner, intermediate, and advanced players. What’s more, you need to track the number of players who start the game versus the number of players that complete the game – and those who fail to complete it or abandon the game as well. Generally, you want a relatively equal balance, and tying all three together in your dashboard helps you analyse the various levels and challenges in your game.
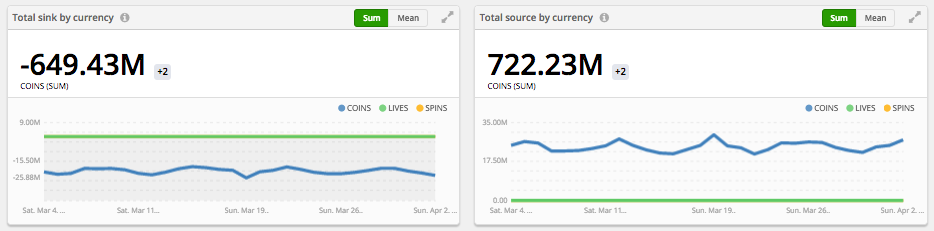
Resources
Monitoring where your players gain or lose resources, at what rates, and how they expend them is also essential. You need to track when they gain or “source” new resources and when they expend or “sink” them in order to make sure the game is operating as expected and there are no barriers or bottlenecks as to how and where players are sourcing and sinking resources.
How Your Dashboards Help You Understand Long Term Trends
Other key parts of your dashboard should show you longer-term trends. This is probably more relevant for monthly or weekly dashboards and reports than the ones you’d design for daily check-ins, since seeing and analysing the trends requires a certain amount of data and of course, that data takes time to generate.
However, many of the same dashboard markers also matter for day-to-day reviews, it’s just a matter of being able to see the bigger picture when you see things laid out over a month or longer. You need enough data to spot trends and shifts over time.
When Real-Time Information Matters…
Sometimes it is amazingly valuable to look at real-time stats and see how they affect your game and its community. What’s more, seeing the community you’ve built come to life as users interact with and play through the game can be fascinating in and of itself.
Reviewing real-time stats might be especially important in the early days of a game’s existence or during major updates or significant changes, since you’ll be able to uncover any issues or problems quickly and (hopefully) fix them before they get bigger. In fact, real-time stats might be the most important canary in the coal mine that you’ll have!
…And When It Doesn’t
You don’t need to be all up in your game’s analytics all the time; all that monitoring and reporting can eat into the time you spend doing everything else, so don’t give into the temptation. Make your analytics work for you, not the other way around.
The point of your analytics dashboard is to streamline your monitoring and reporting process, not give you something new to distract yourself with or create more work.
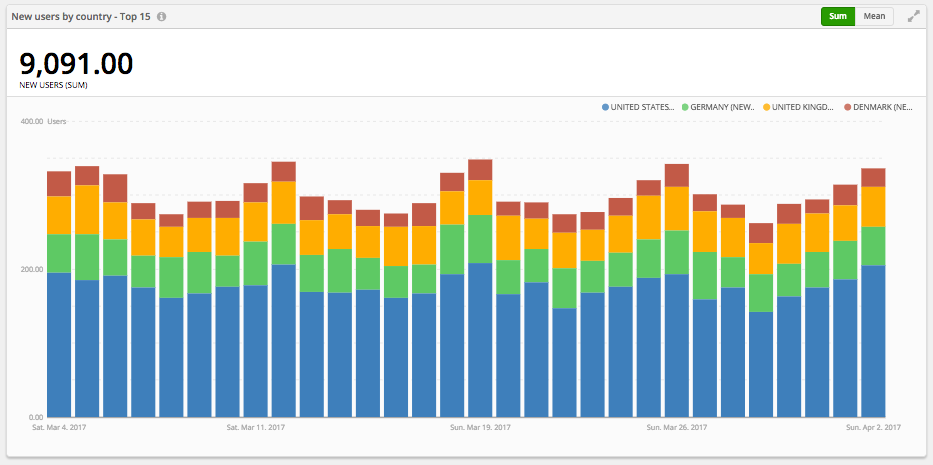
Location, Location, Location
Naturally, you’ll want to know where your players are located, whether your game is worldwide or geo-targeted to certain regions. Being able to add filters so you can see how your game is functioning and performing by regional or city level is key to make sure your whole community is healthy and receiving the same type of playing experience. Plus, you can discover where your biggest fans are and perhaps find ways to appeal to them!
Lay It Out Well: The One Question To Ask Yourself While Building A Dashboard
Last but not least, you need to consider the layout of your dashboard. While you can have all the right metrics in the dashboard, if the layout doesn’t work for you, or makes it complicated to figure out what you should care about, then it’s not efficient enough. That’s where determining what metrics matter most for your individual game and process really counts – having simplified daily, weekly, and monthly dashboards doesn’t matter if you’re going to be going through tons of reports anyway, or have a difficult time finding the info you actually need.
You should be able to ask “how is my game doing?” and get the answer in the first ten seconds or so of viewing your analytics dashboards. If that’s not the case, you need to adjust the layout, perhaps simplify or reduce the number of metrics you track, and consider what you really need to see on a regular basis.
Time To Build!
Any questions about the metrics we’ve mentioned in this post? Check out this handy reference chart or get in touch with the GameAnalytics crew.